
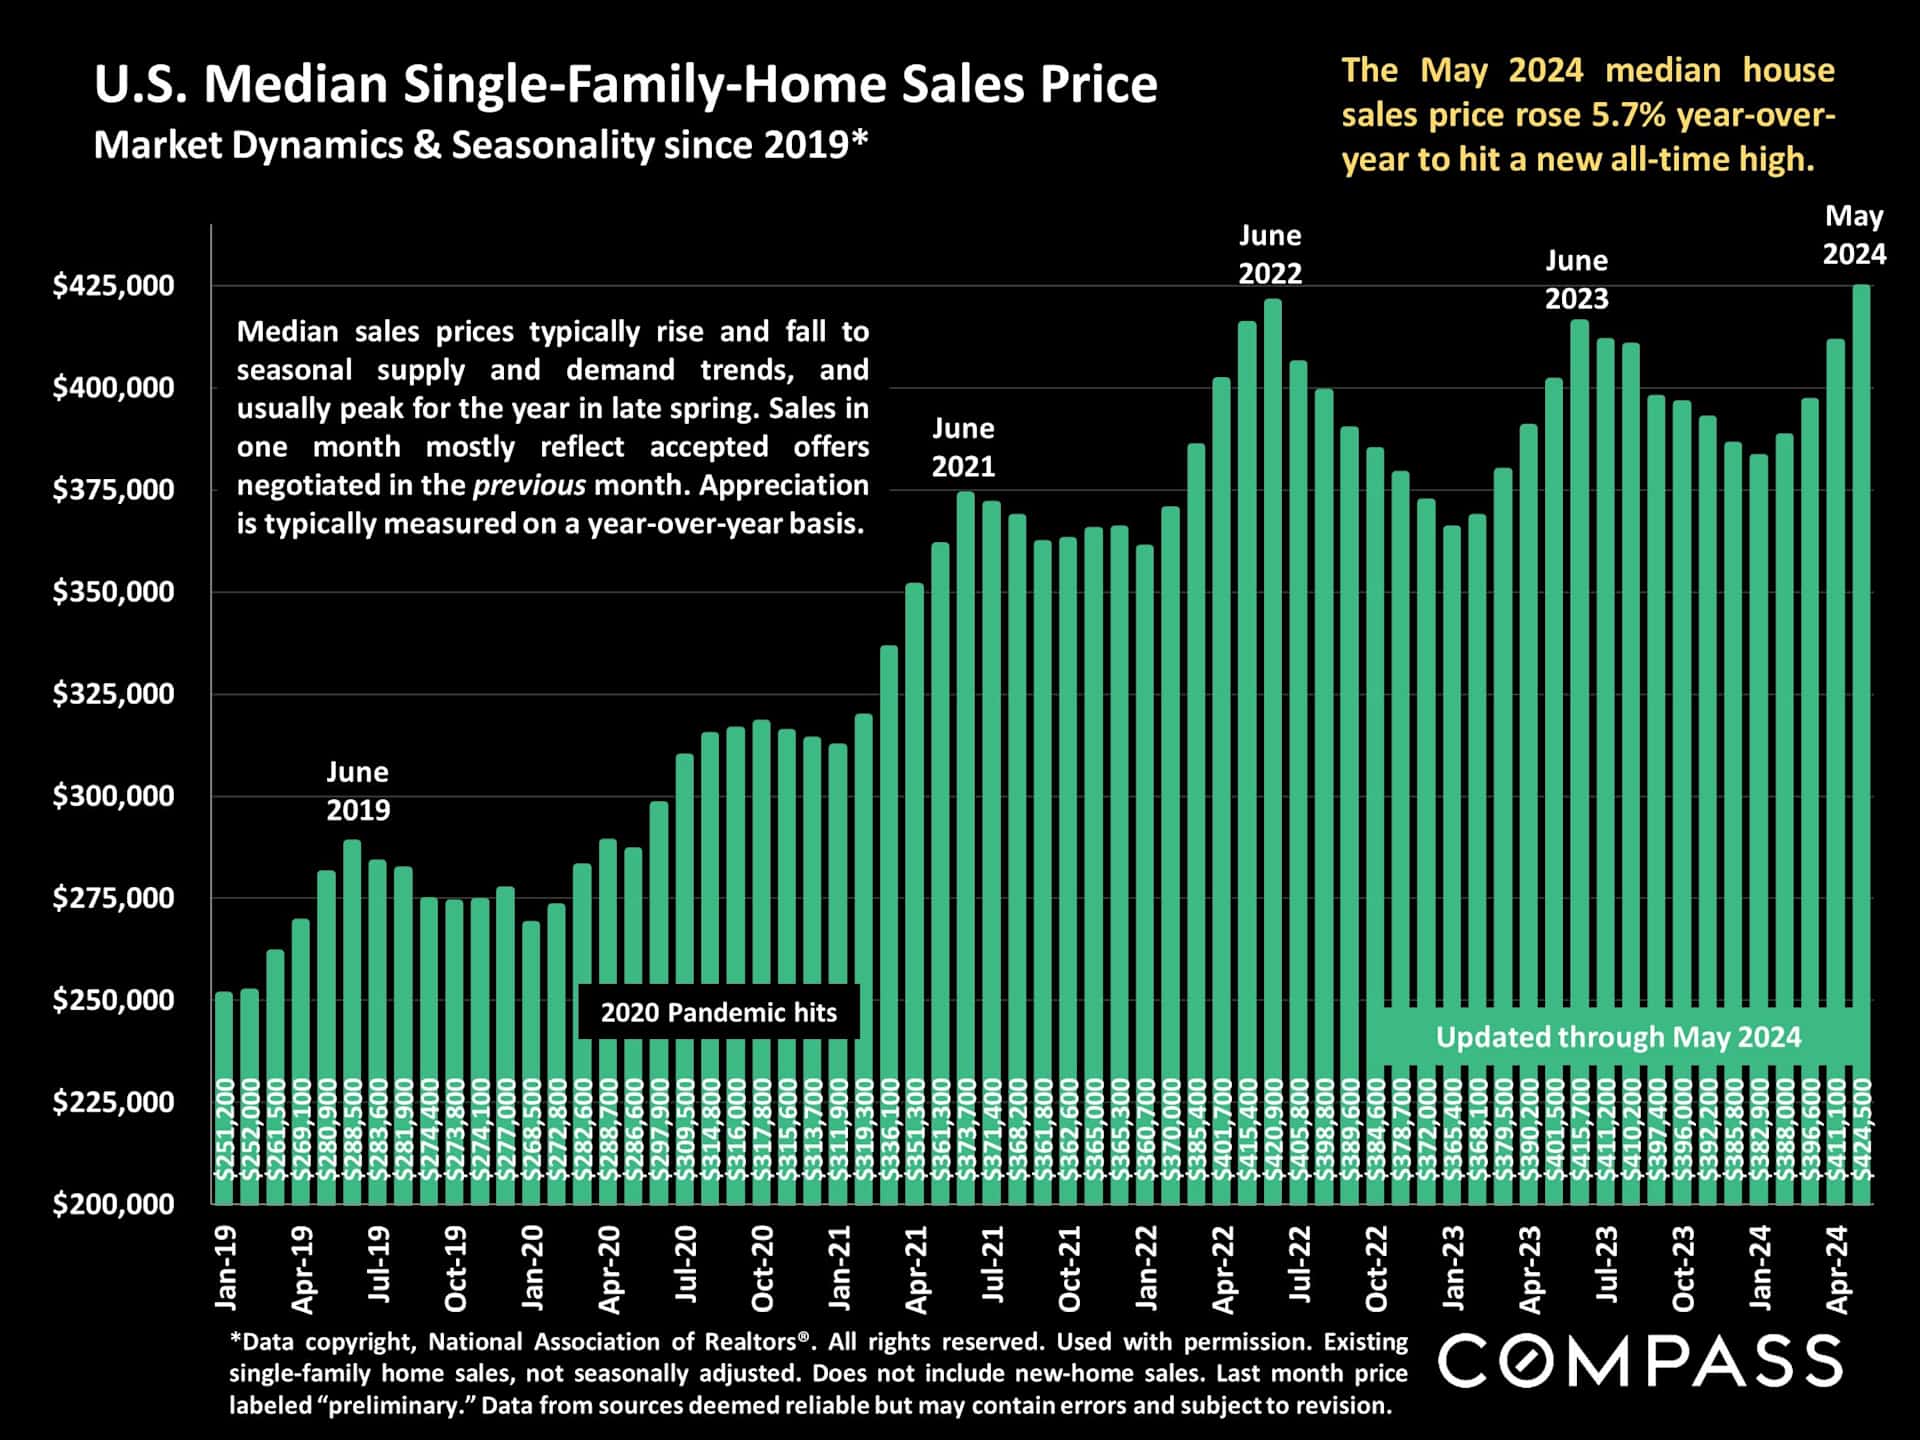
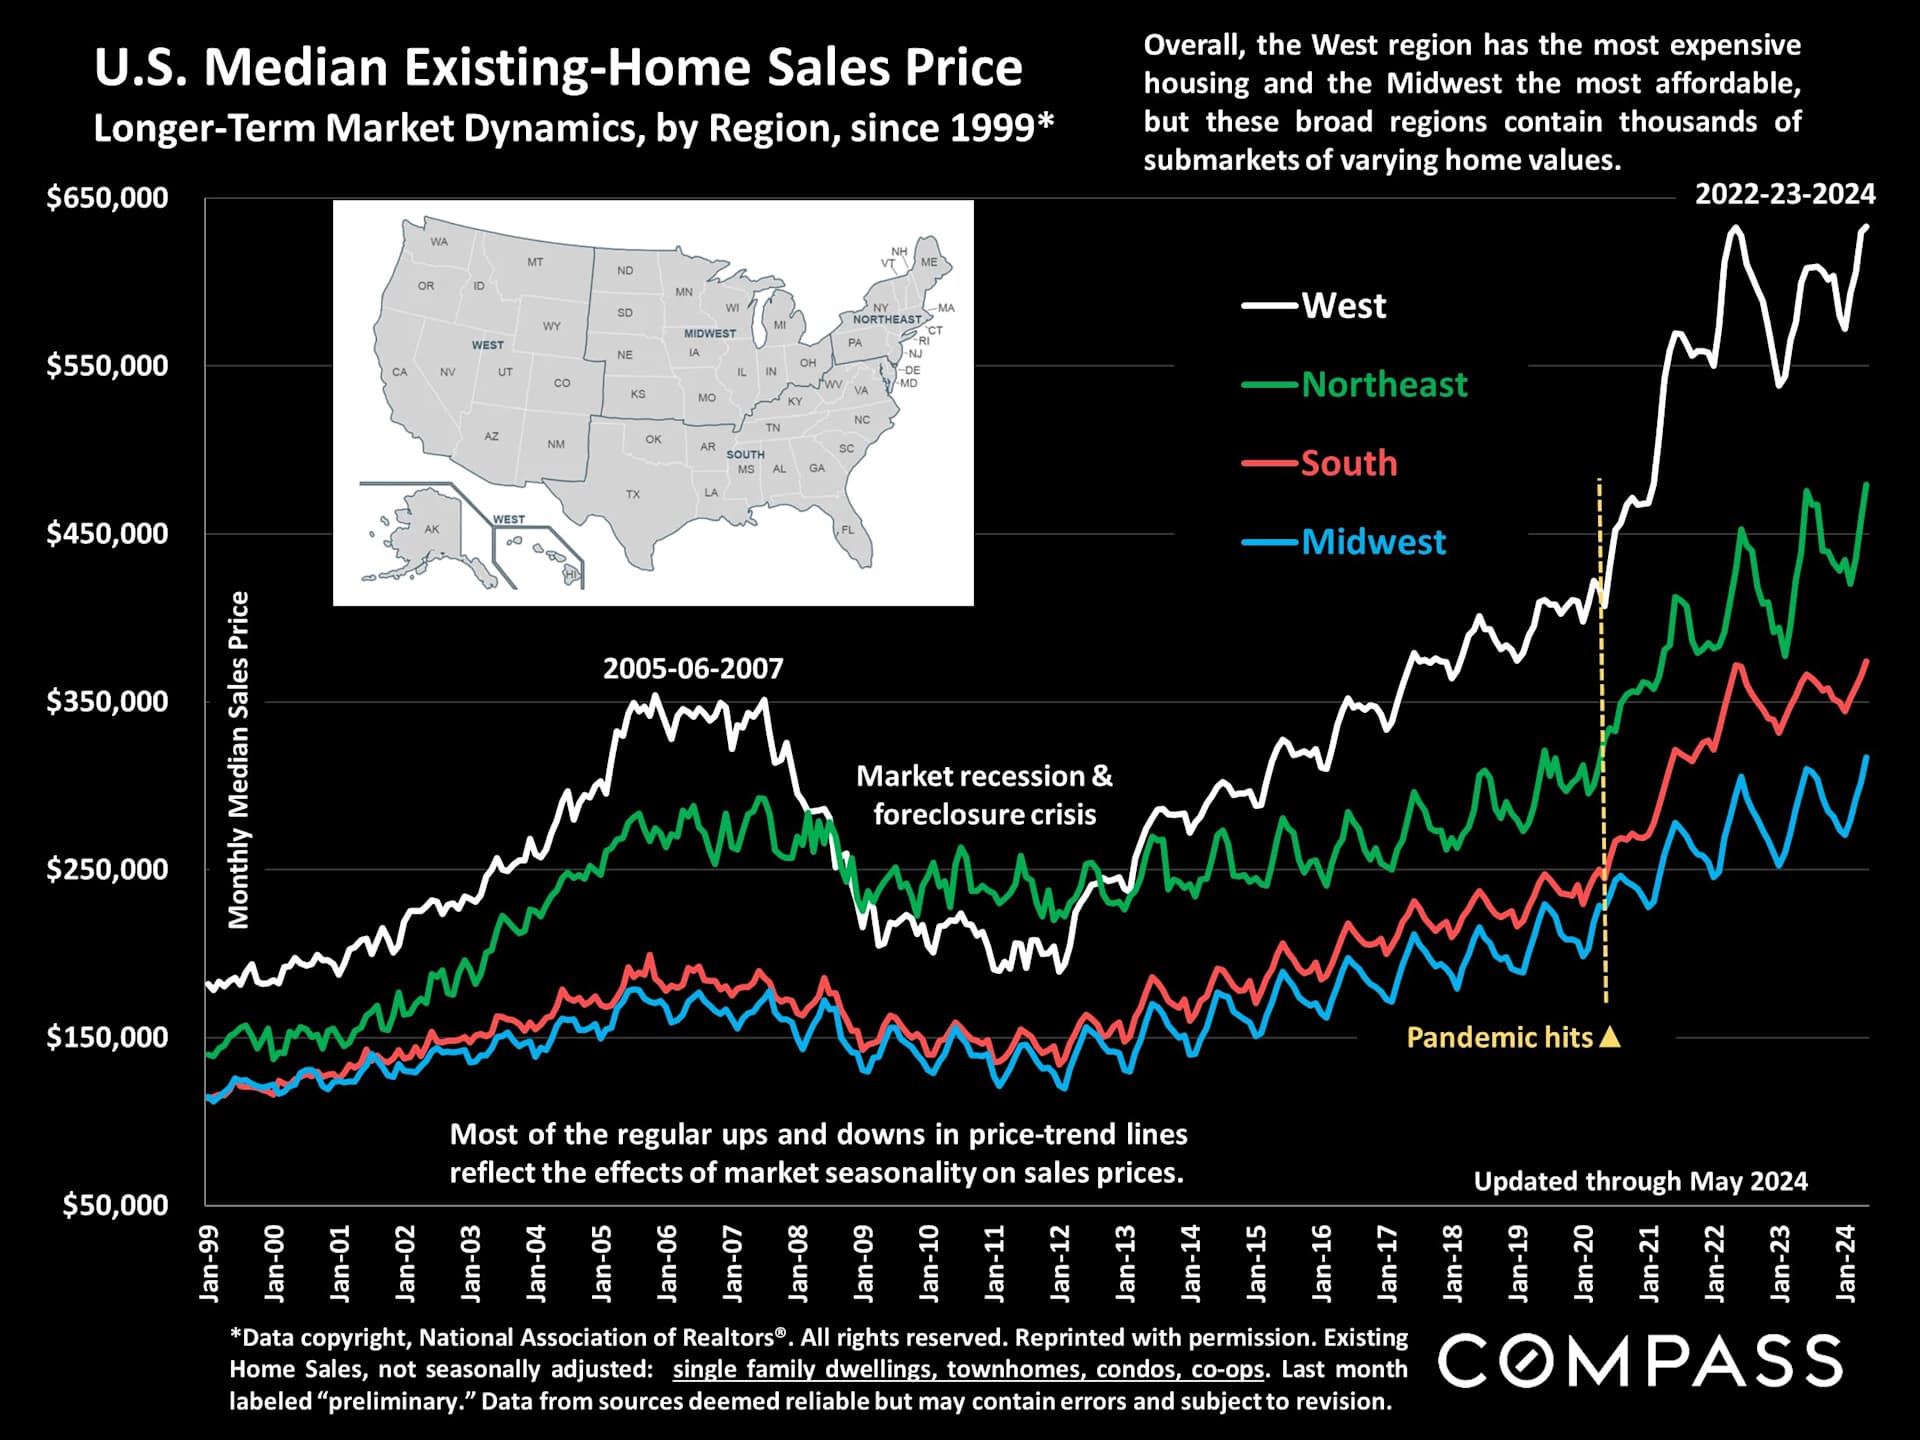
The U.S. median house sales price jumped in May to its highest point ever, $424,500, surpassing its previous peak at the end of the pandemic boom.
The median condo/co-op sales price in May rose to yet another new high, $371,300. Condos and co-ops are generally a more affordable alternative to houses, found mostly in metro-area markets.
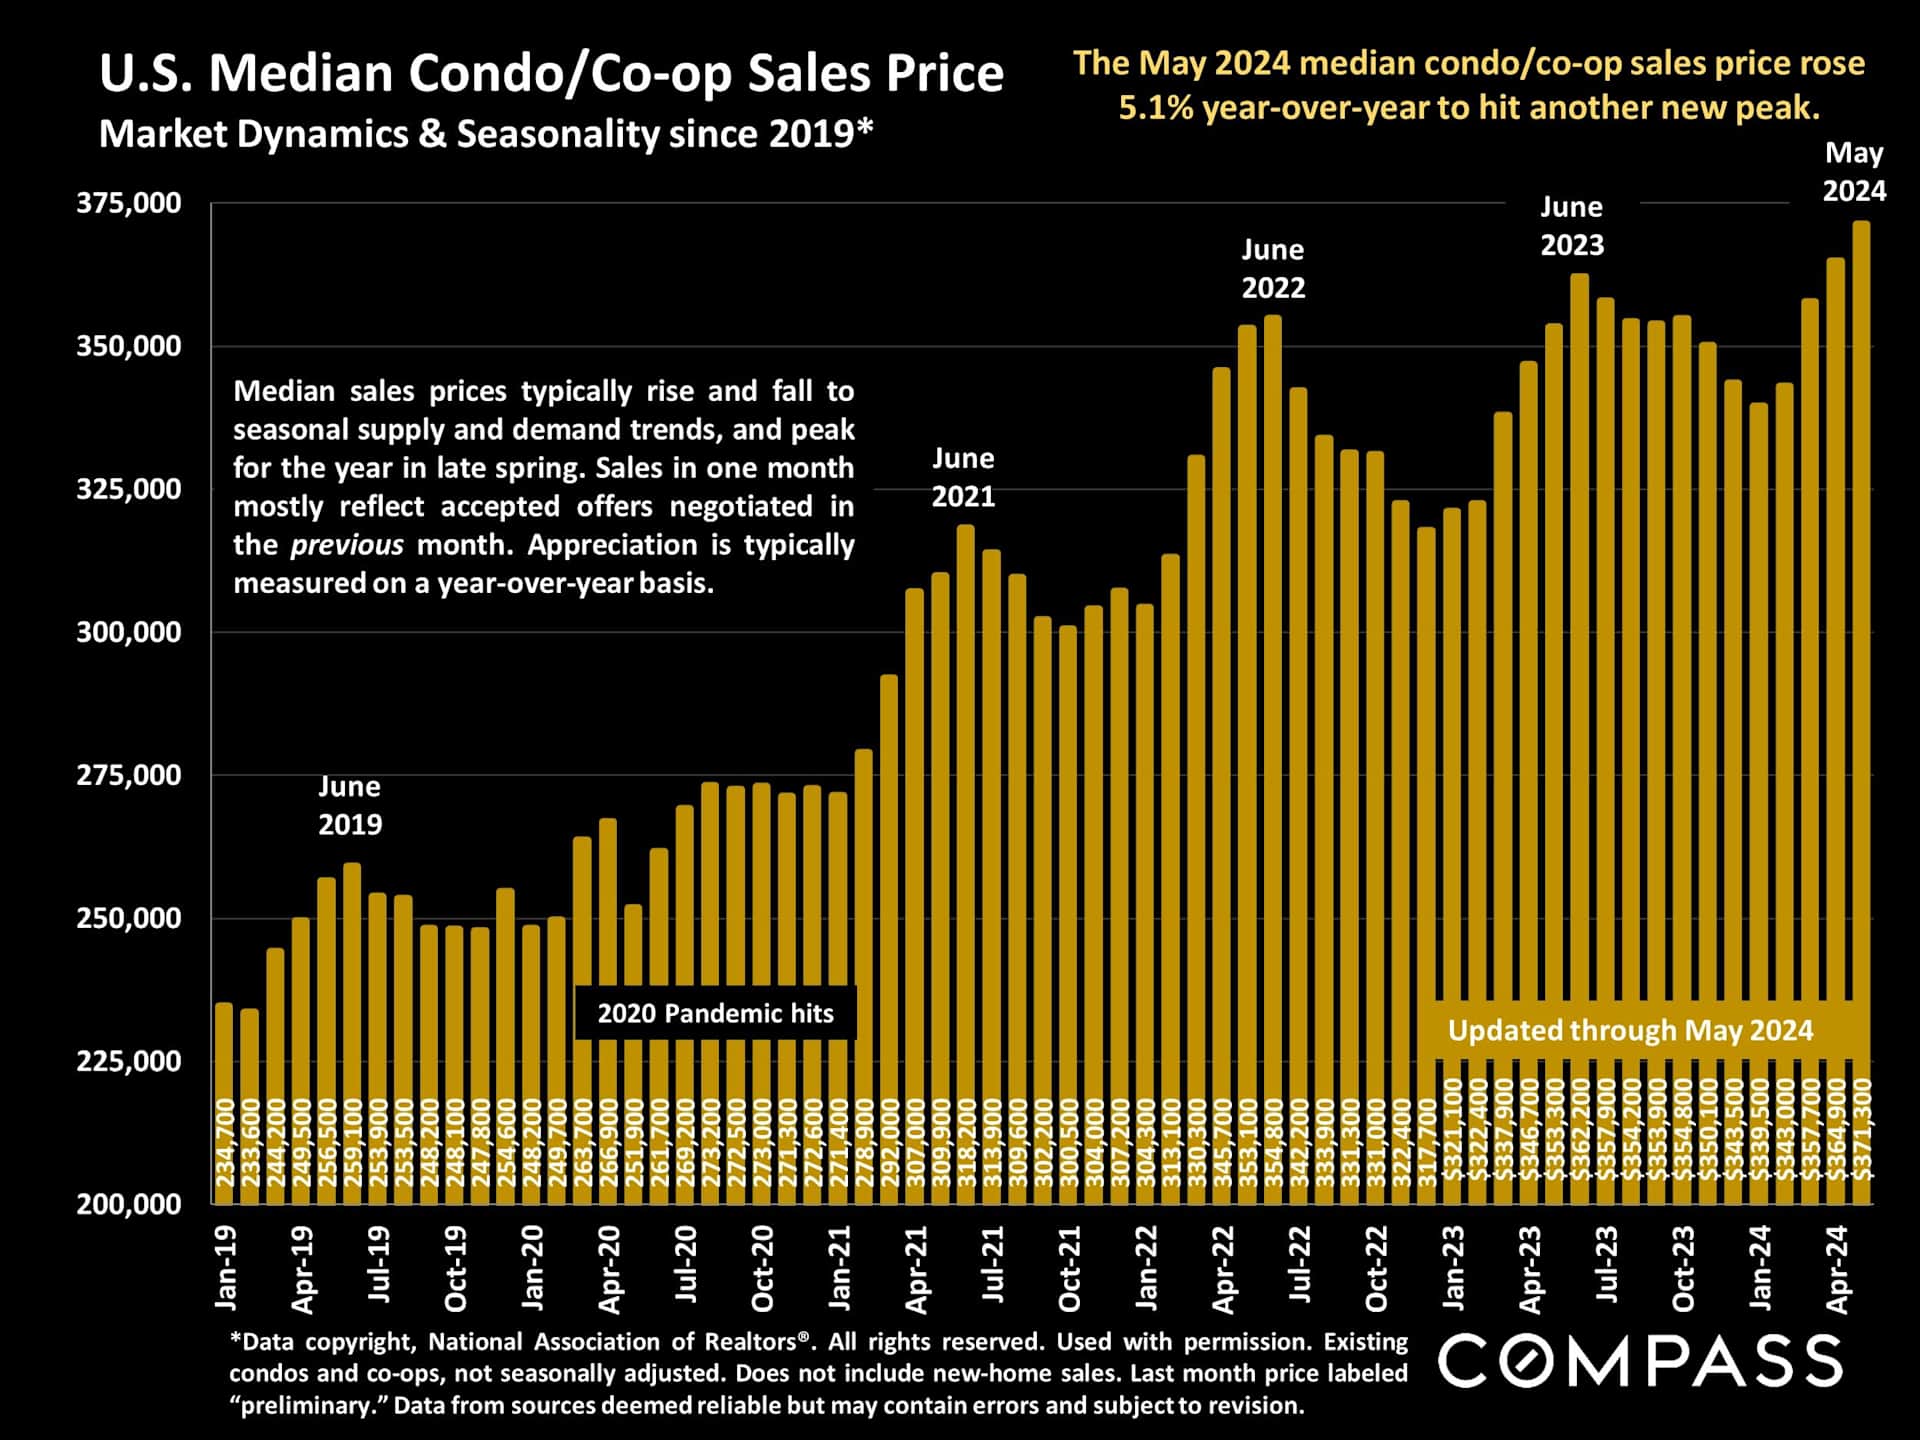
Median sales prices have been rebounding in all 4 national regions. Many of the regular ups and downs in trend lines reflect the effects of market seasonality, though, of course, major changes in economic conditions - such as interest rates plunging (2020-21) or soaring (2022) - can cause values to quickly rise or fall.
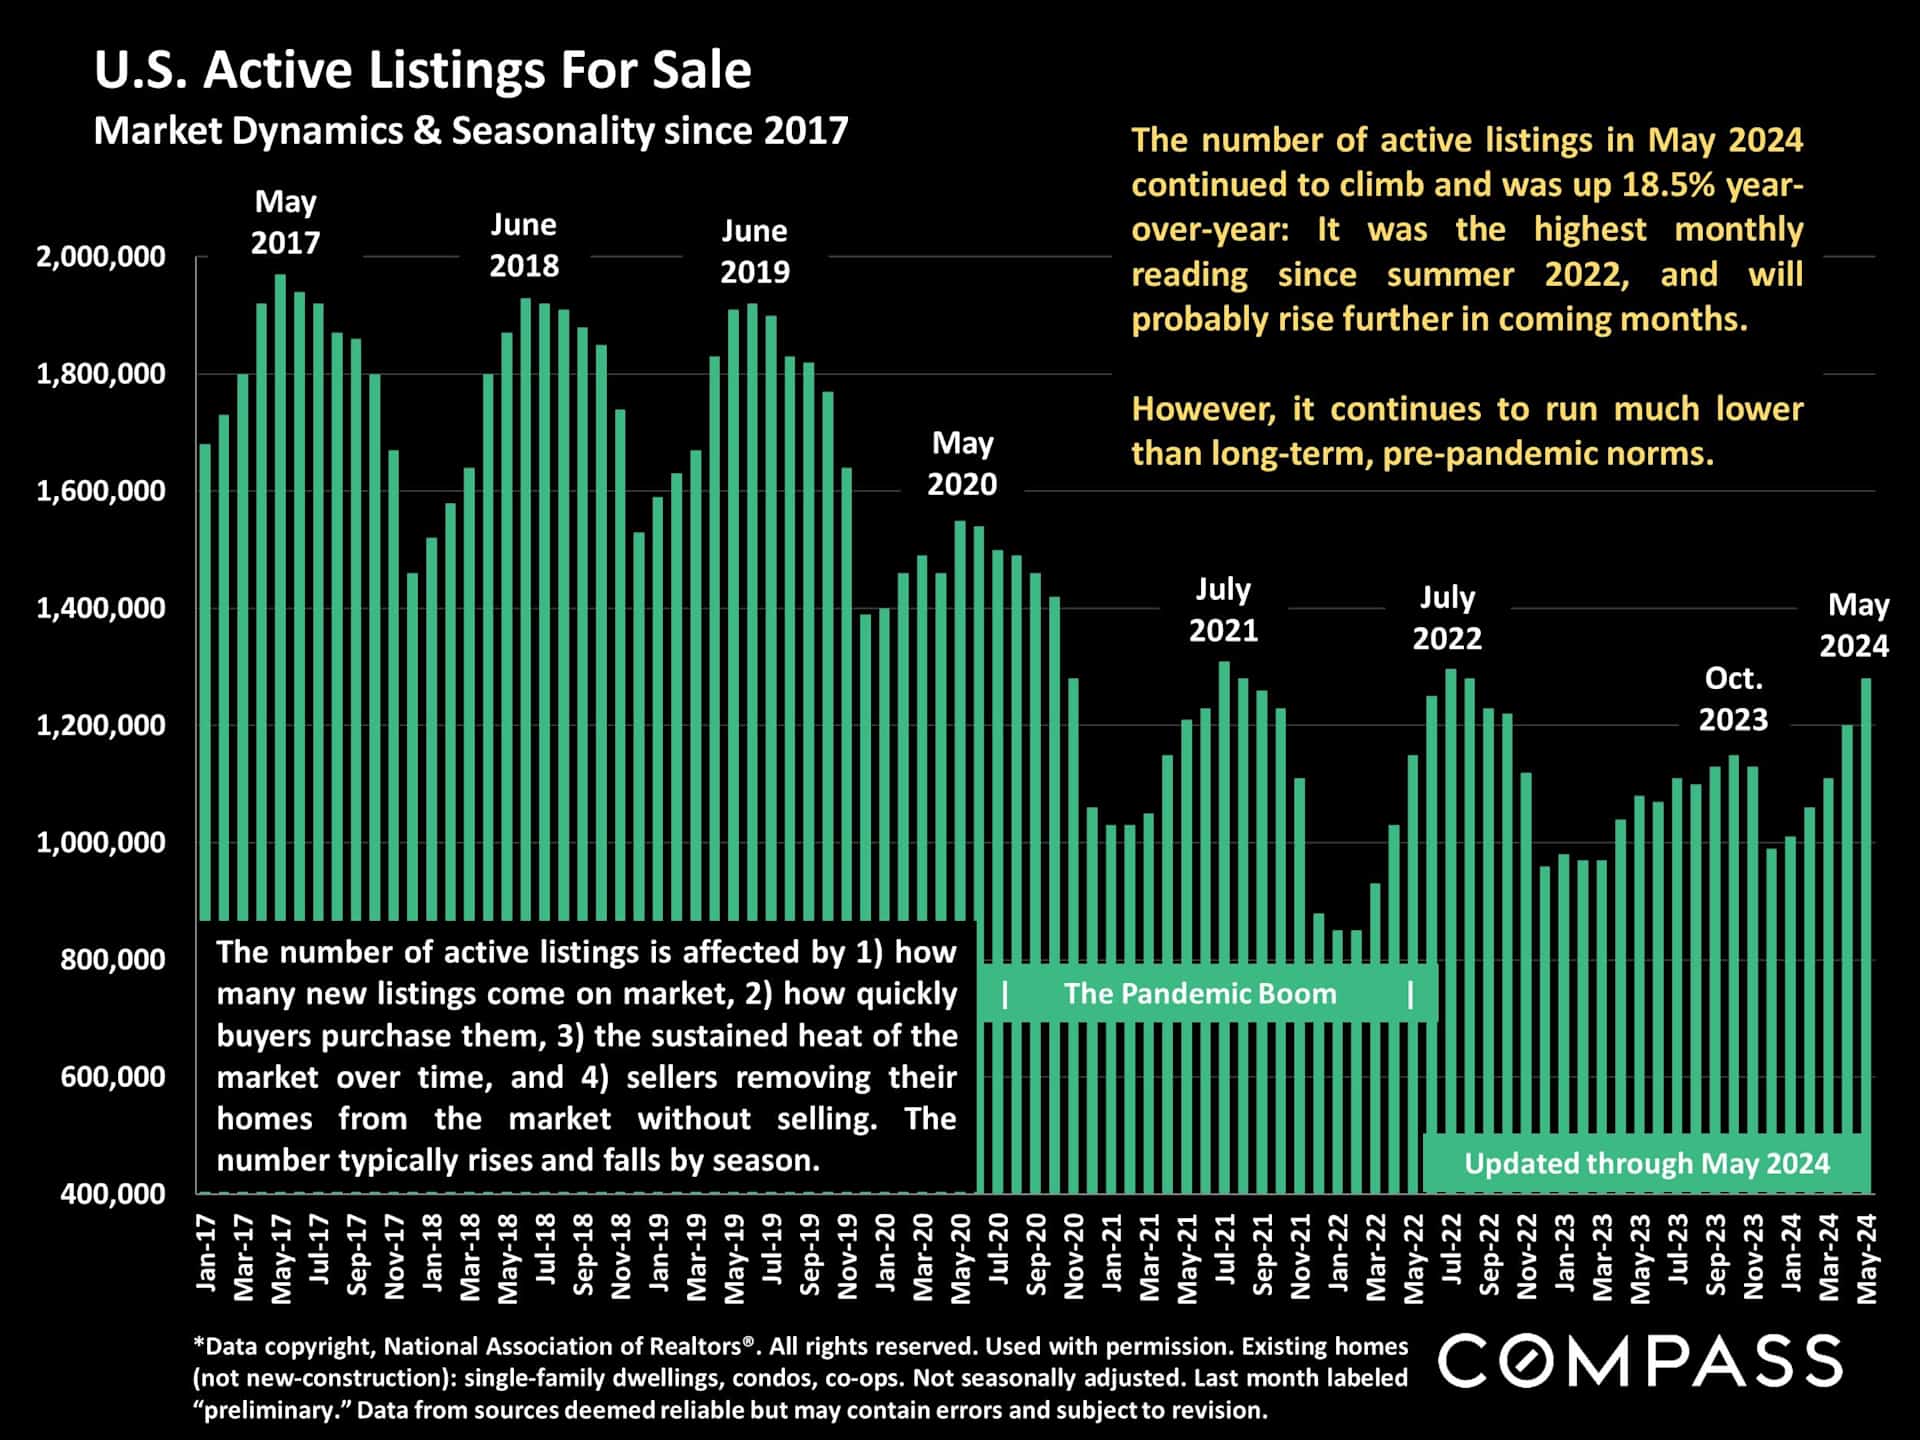
The number of homes for sale has been rapidly increasing, reaching its highest level in almost 2 years. Though still very low by long-term standards, this is a significant shift in market dynamics.
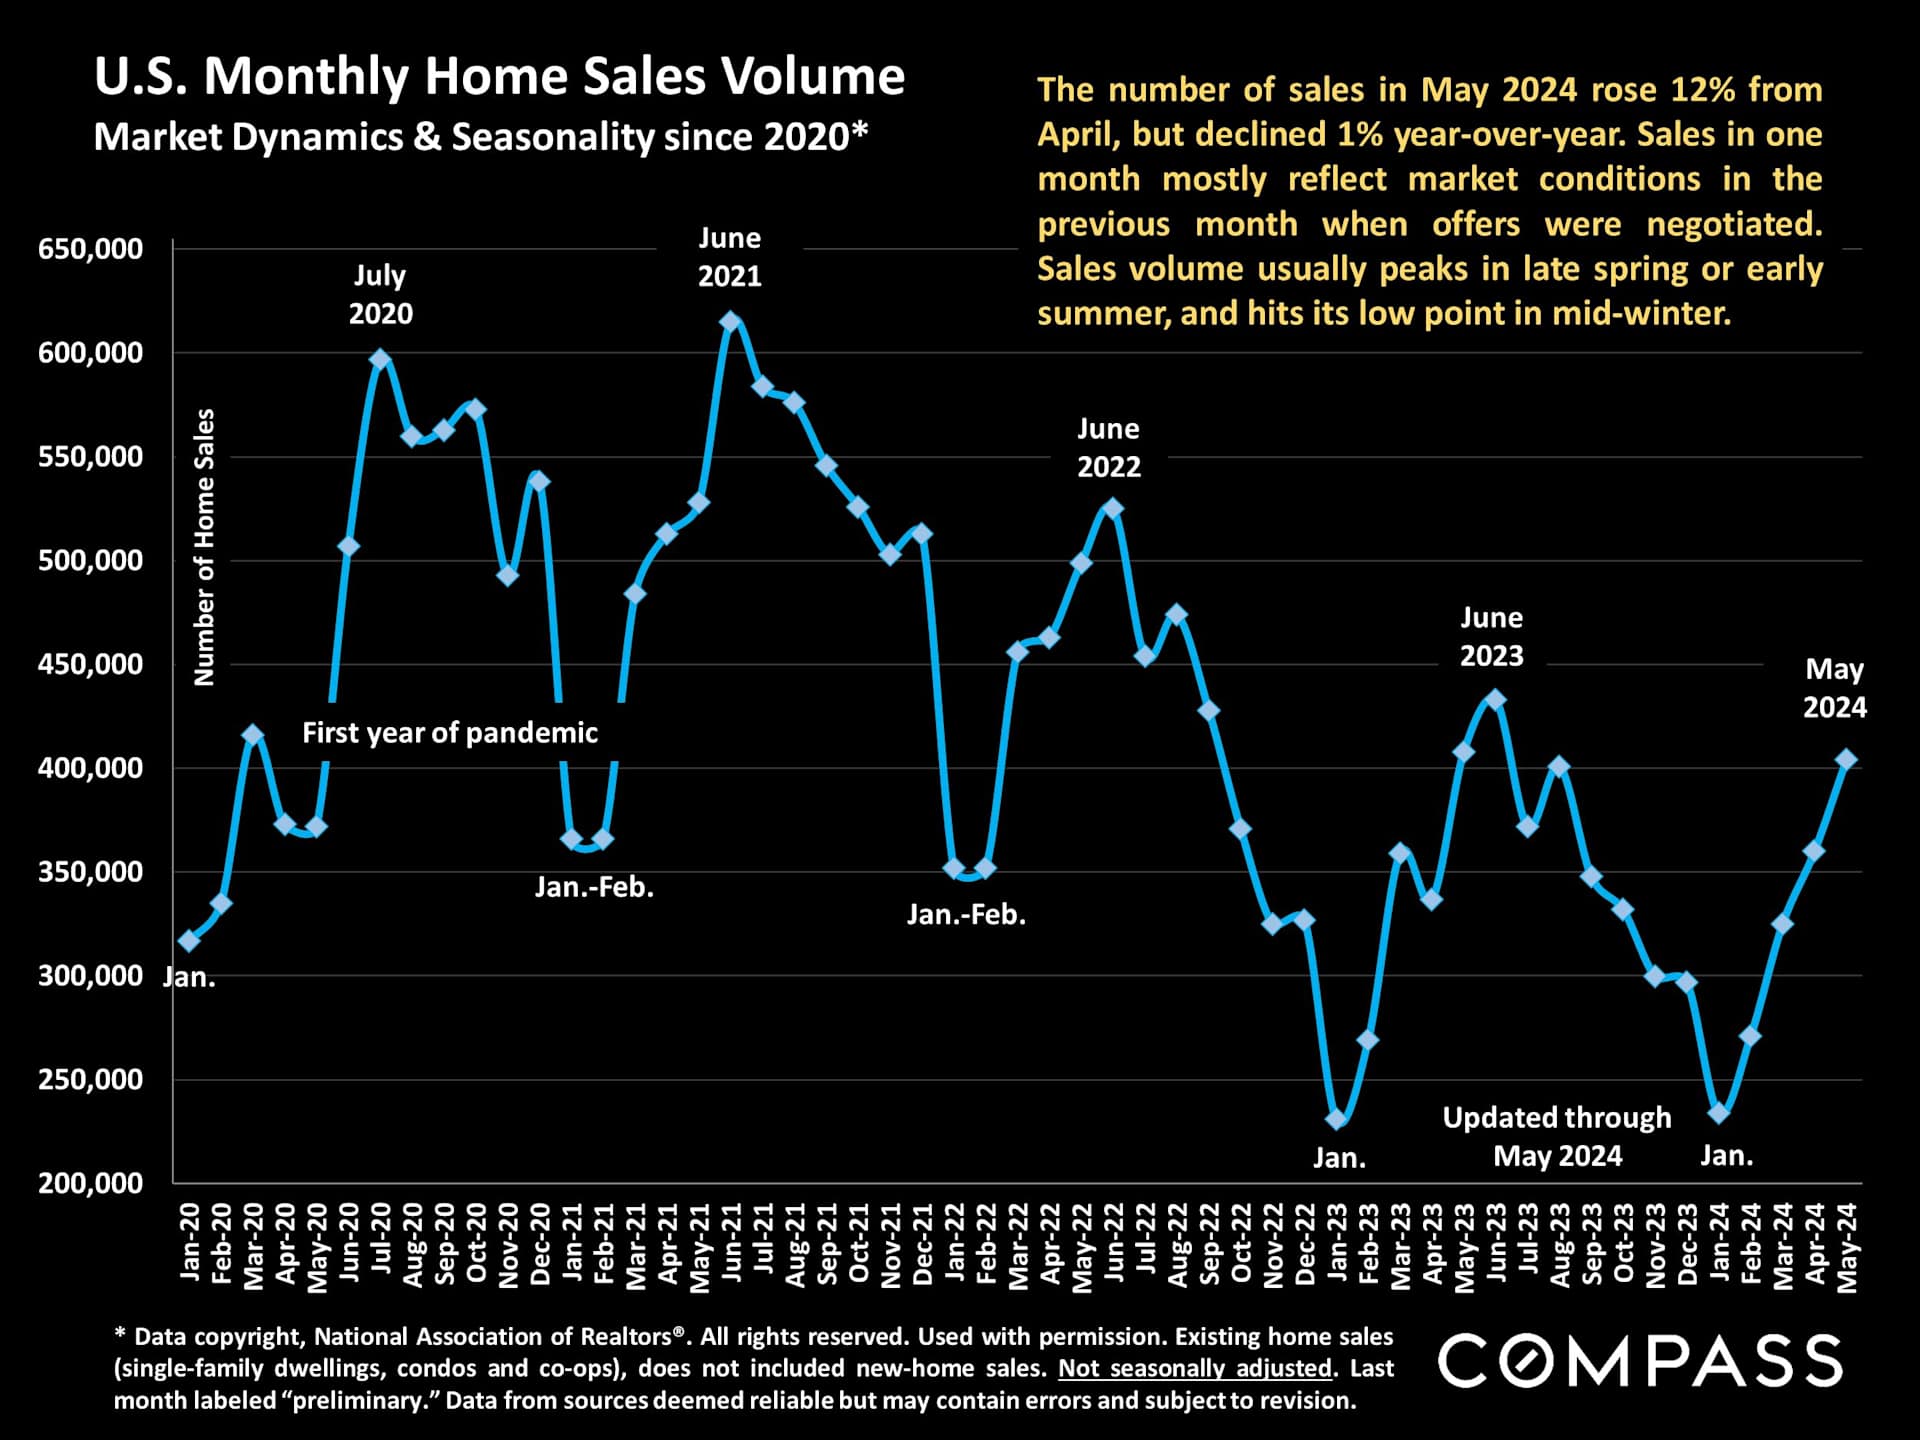
As typical, sales activity accelerated in spring, but the May number was slightly down on a year-over-year basis. Sales volume usually peaks for the year in June, mostly reflecting accepted-offer activity in May.
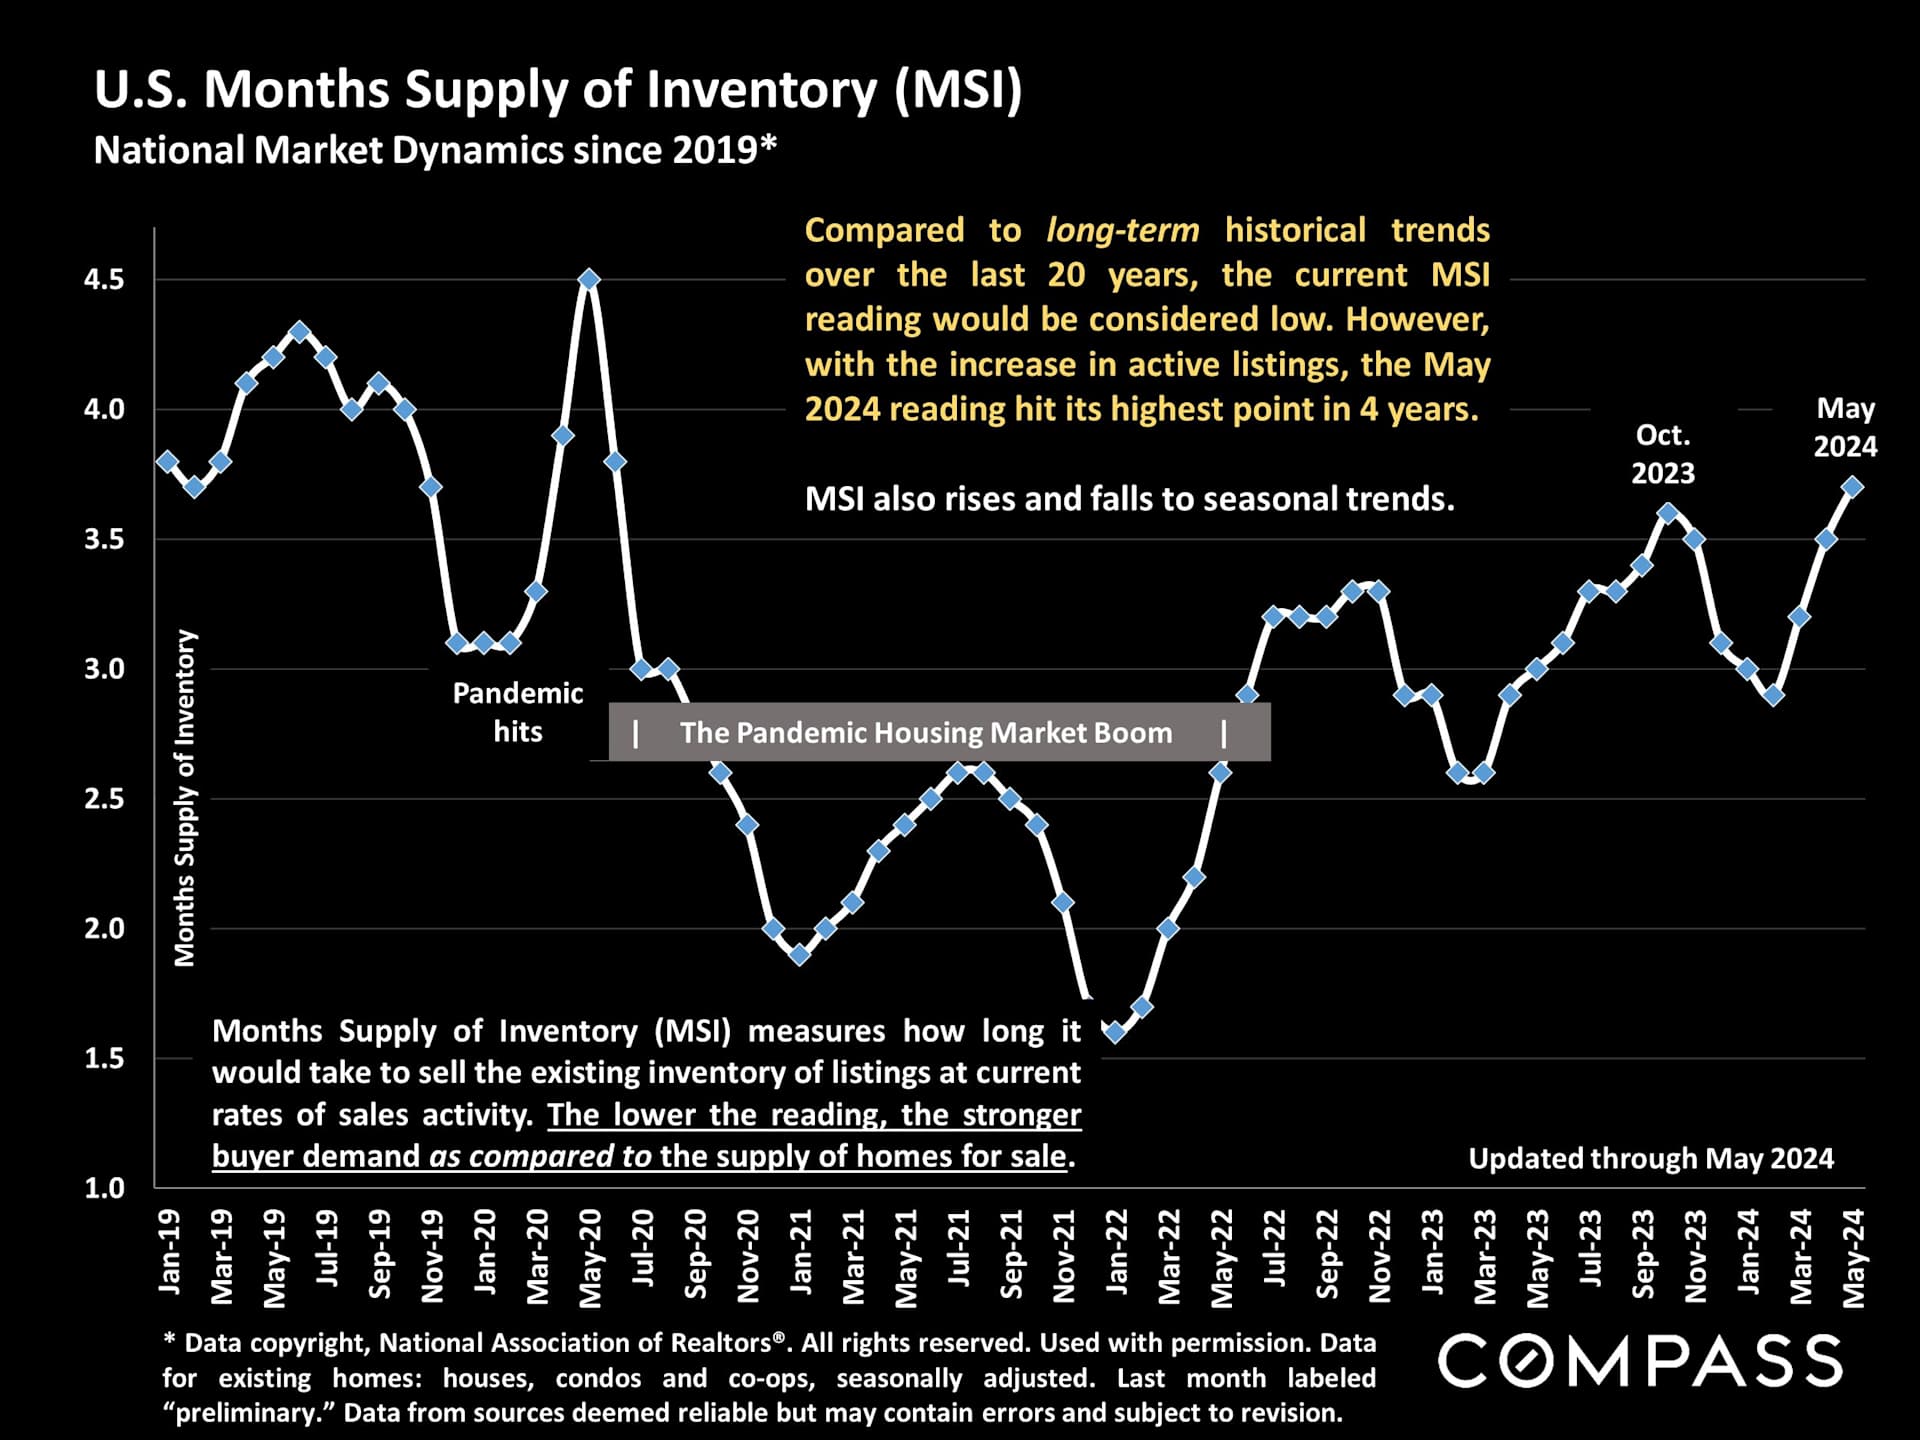
Months-supply-of-inventory (MSI) measures supply as compared to demand: Lower readings signify more heated conditions. With the inventory of listings increasing faster than sales, MSI just hit its highest point since spring 2020.
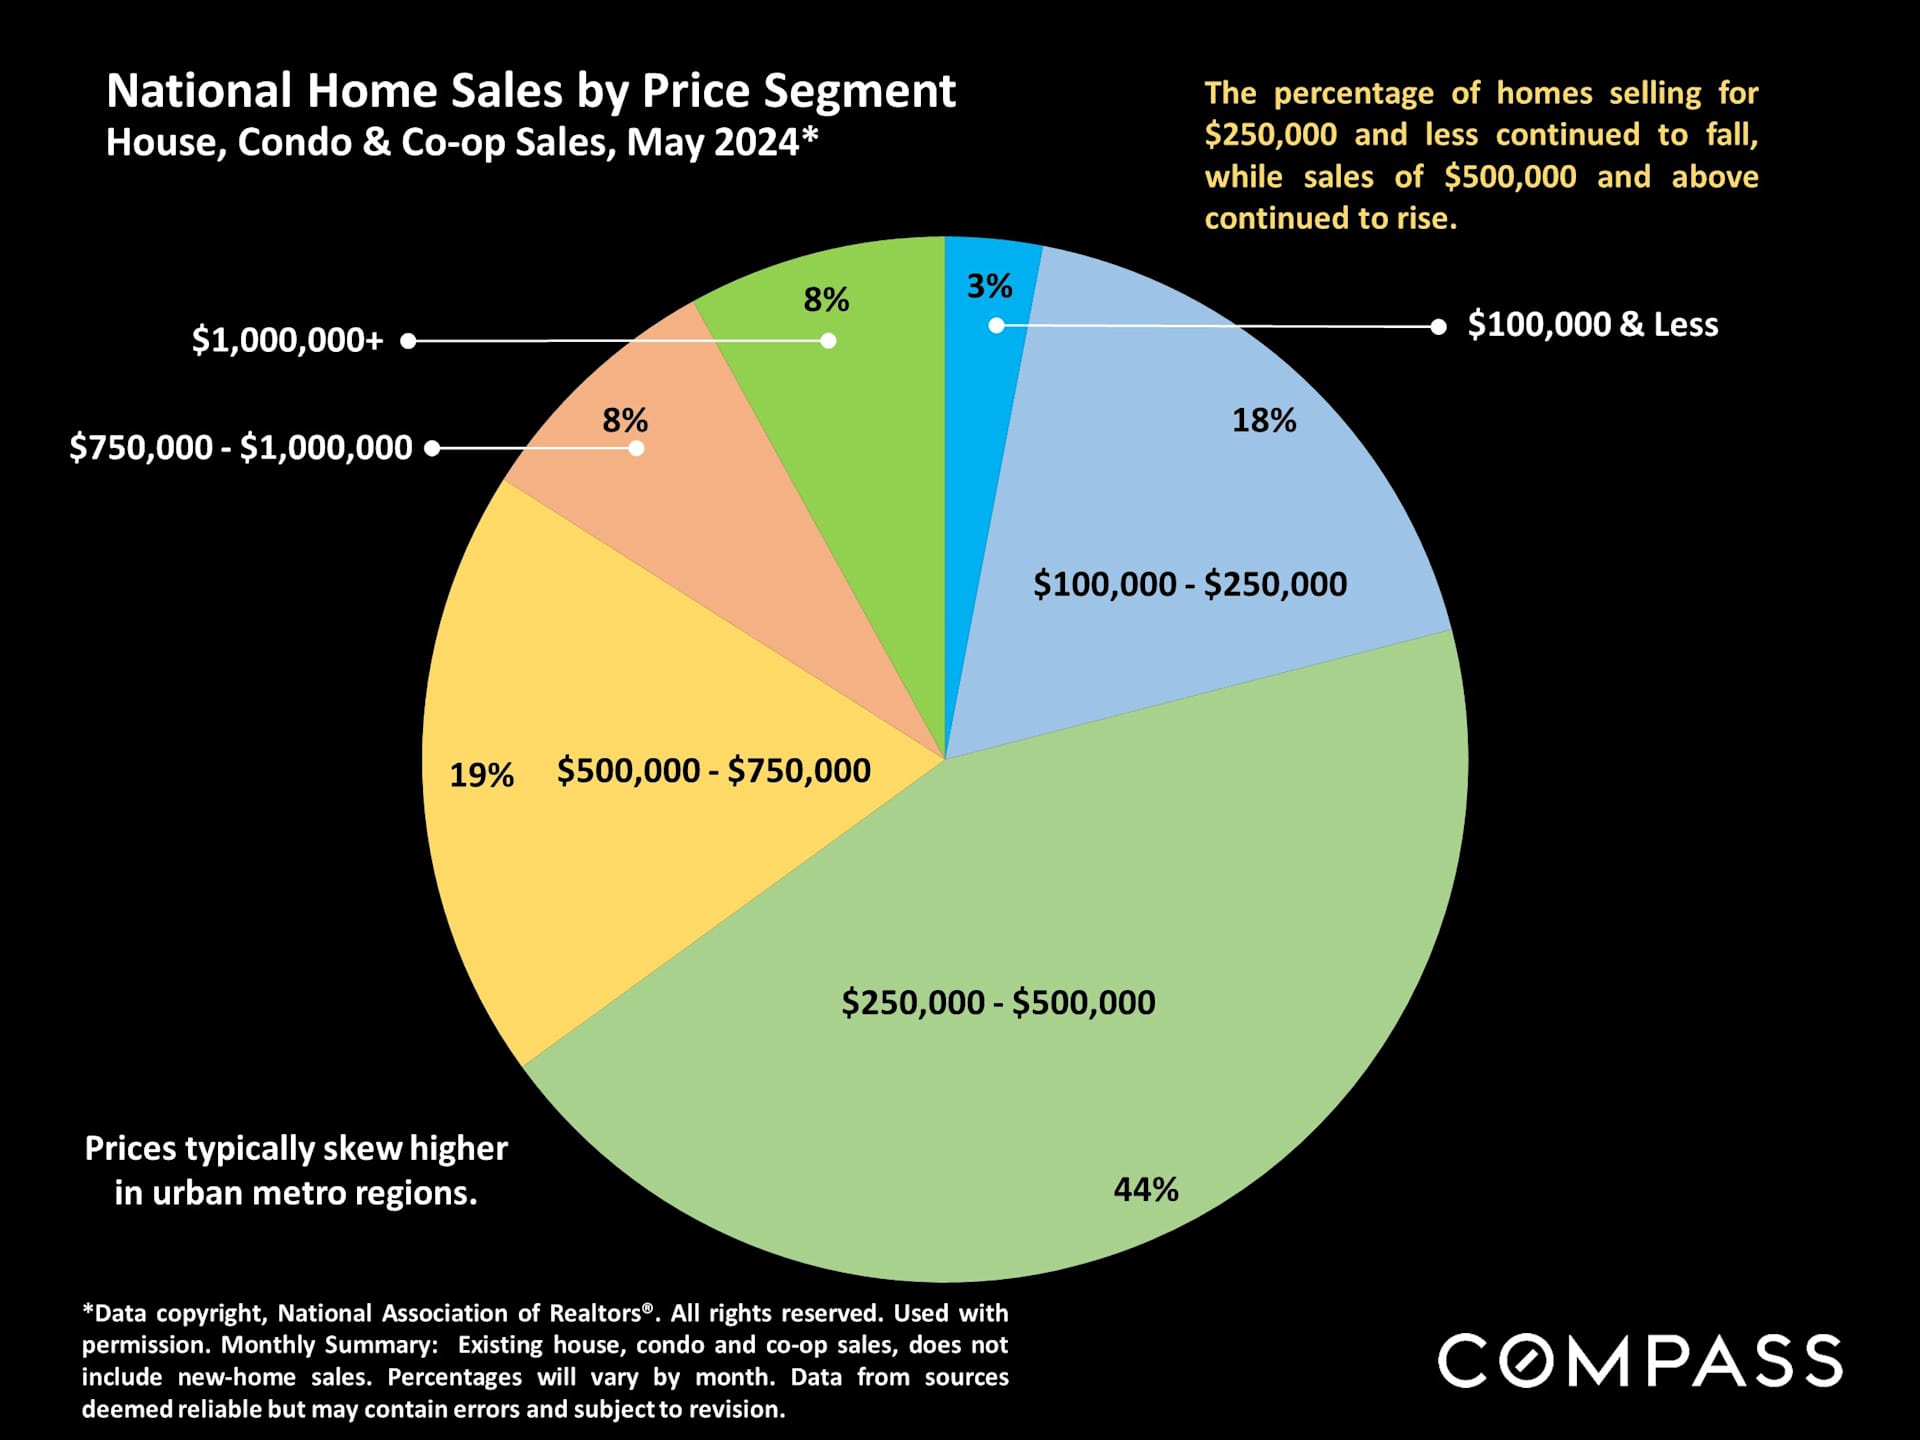
A snapshot of sales prices across the country. In more affluent markets, the distribution of prices can skew much higher: In some, the majority of homes sell for over a million dollars, compared to 8% nationally.
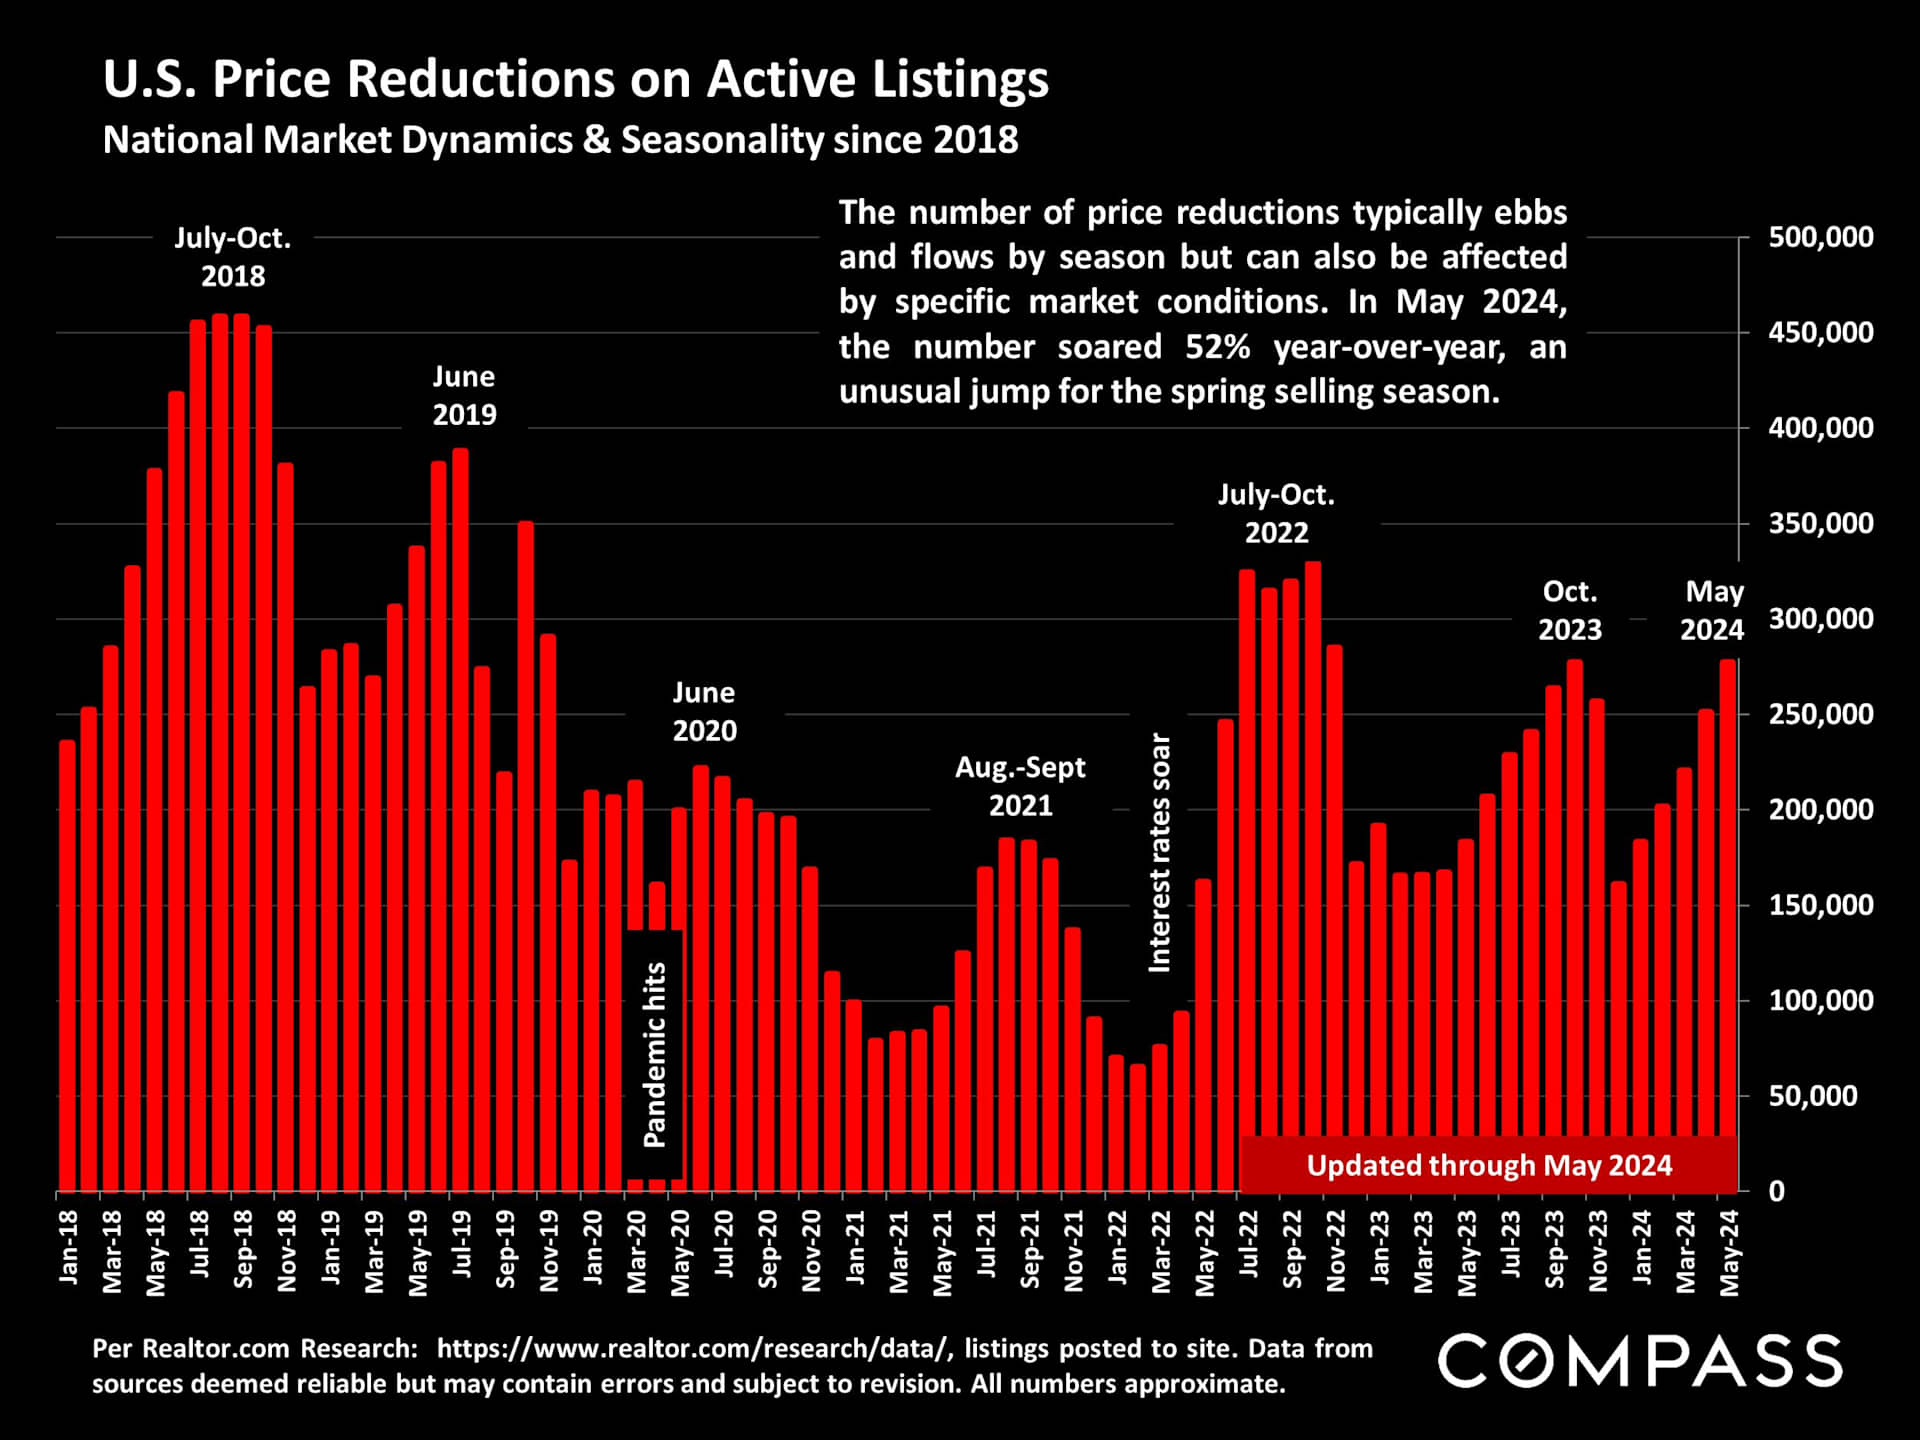
It's unusual for the number of price reductions to climb so rapidly in spring. On one hand, buyers are still competing for many listings, pushing prices higher. But some sellers are now having to compete for buyers by dropping their asking prices.
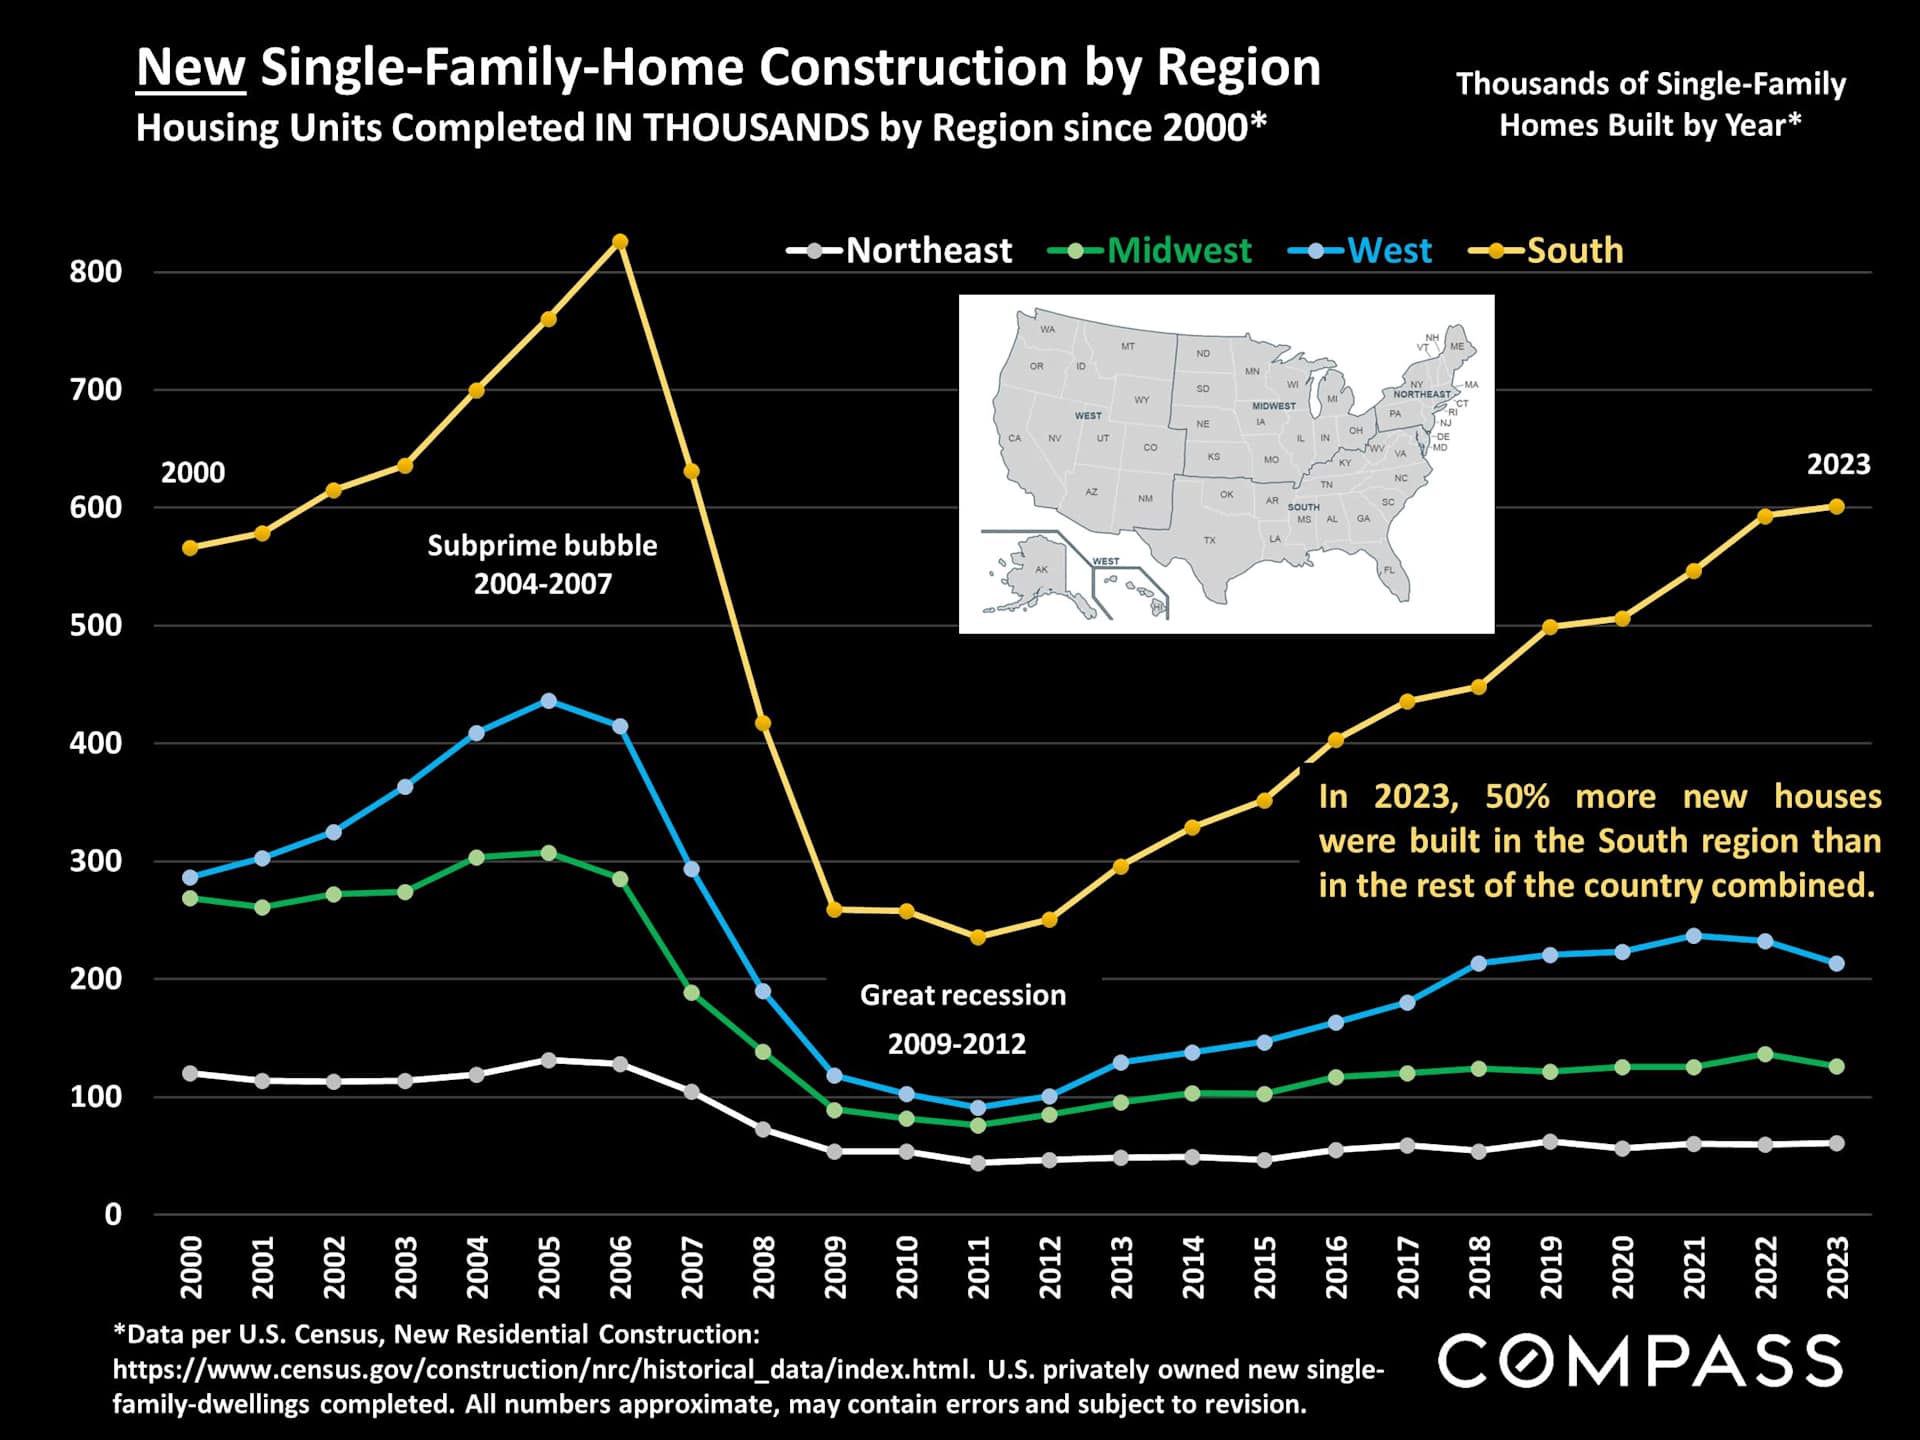
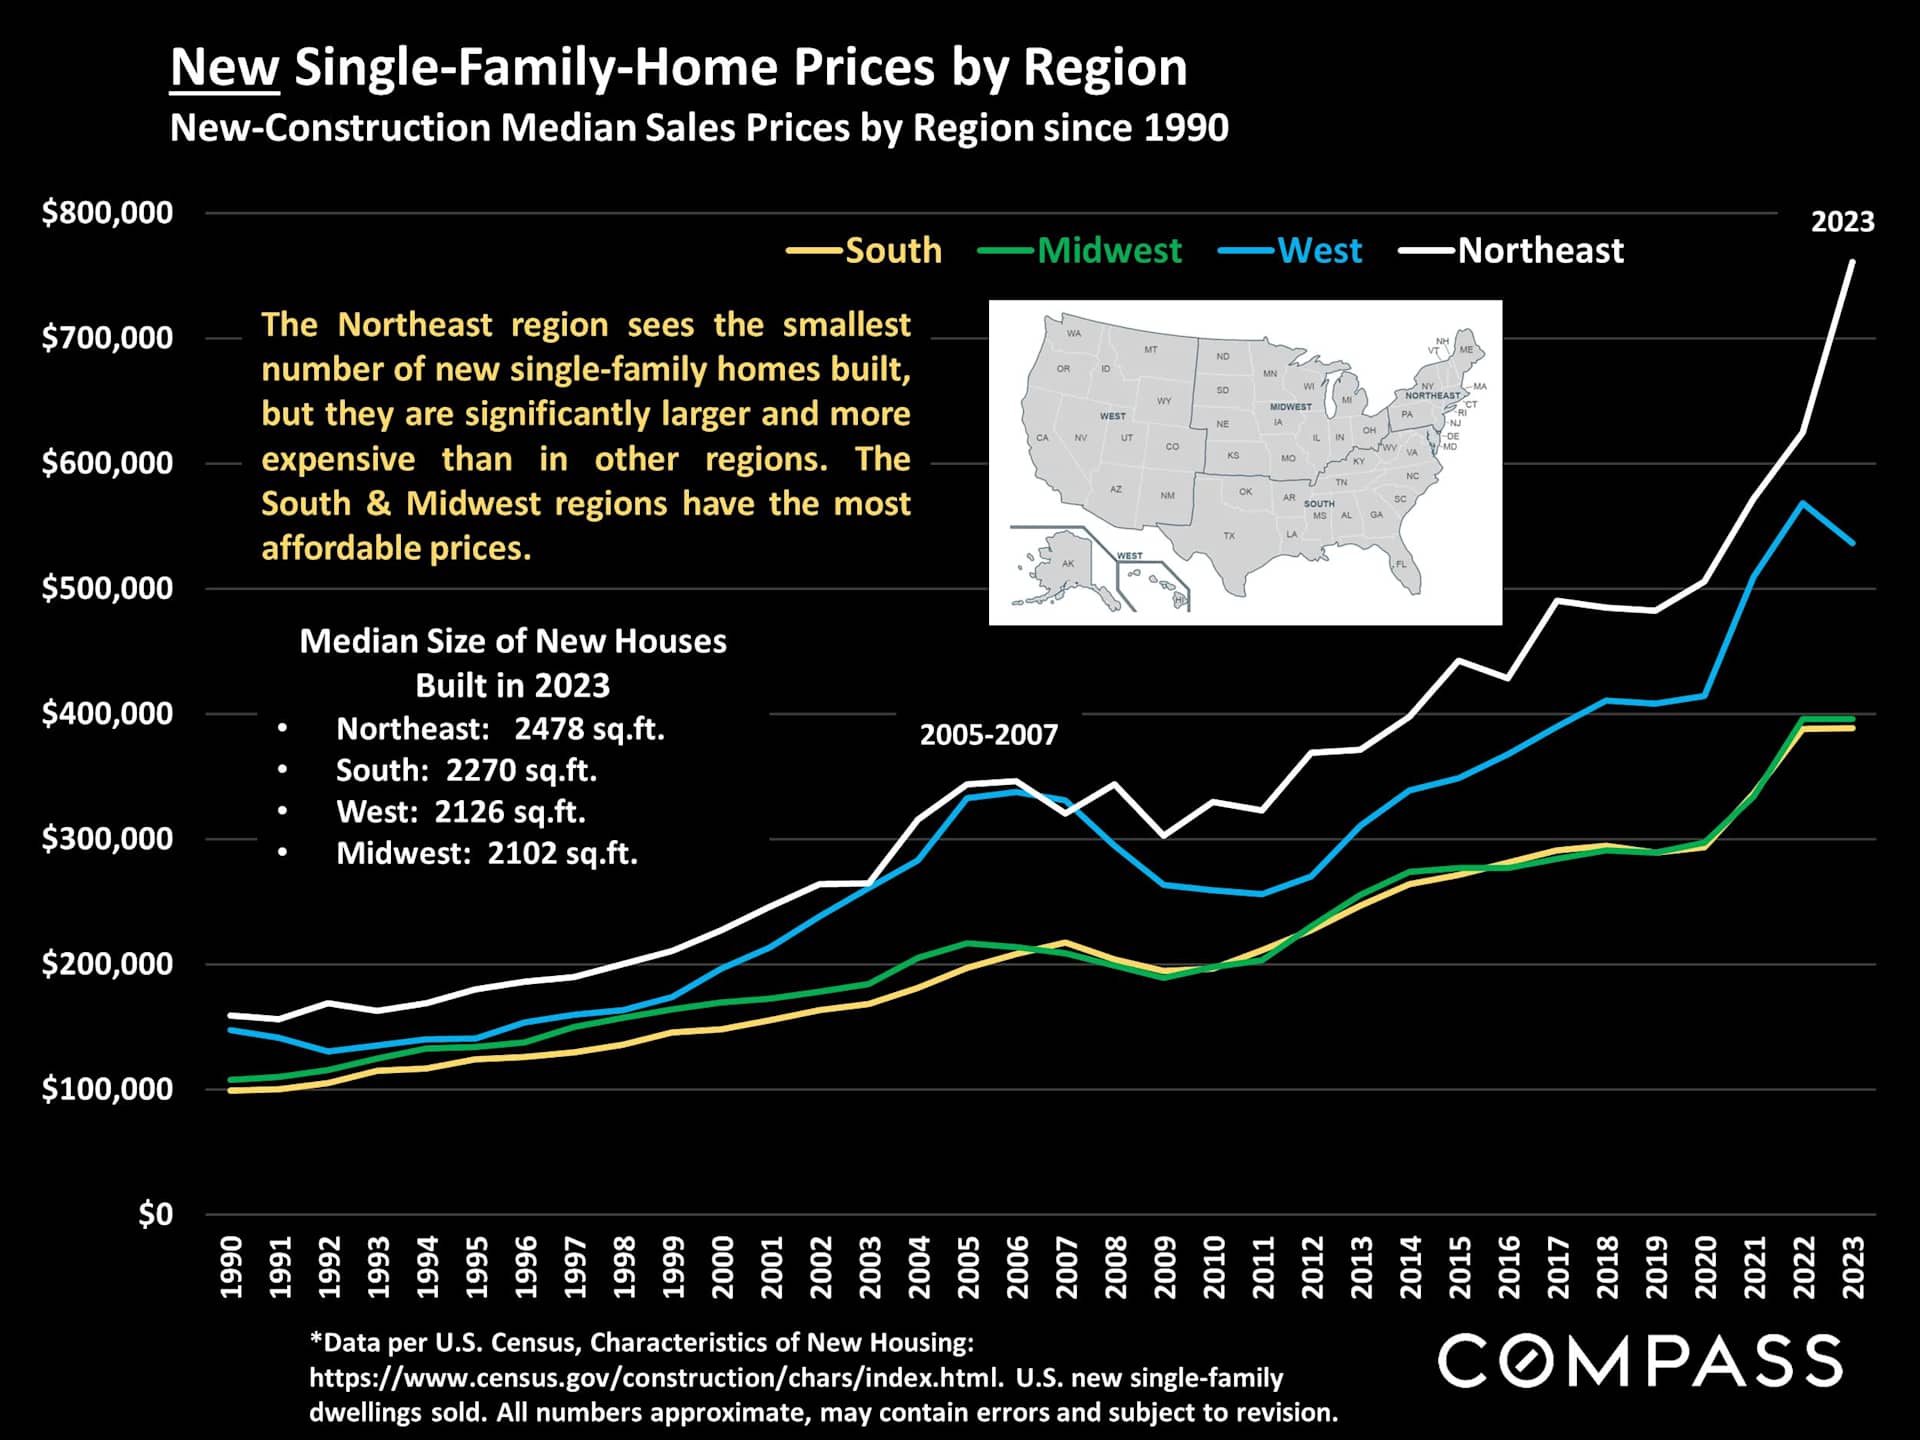
Led by Texas, Florida and North Carolina, the South region of the U.S. dominates new-home construction. State populations here have been growing quickly, and one reason - illustrated in the 2nd chart below - is that new houses are generally much more affordable than in the West and Northeast regions.
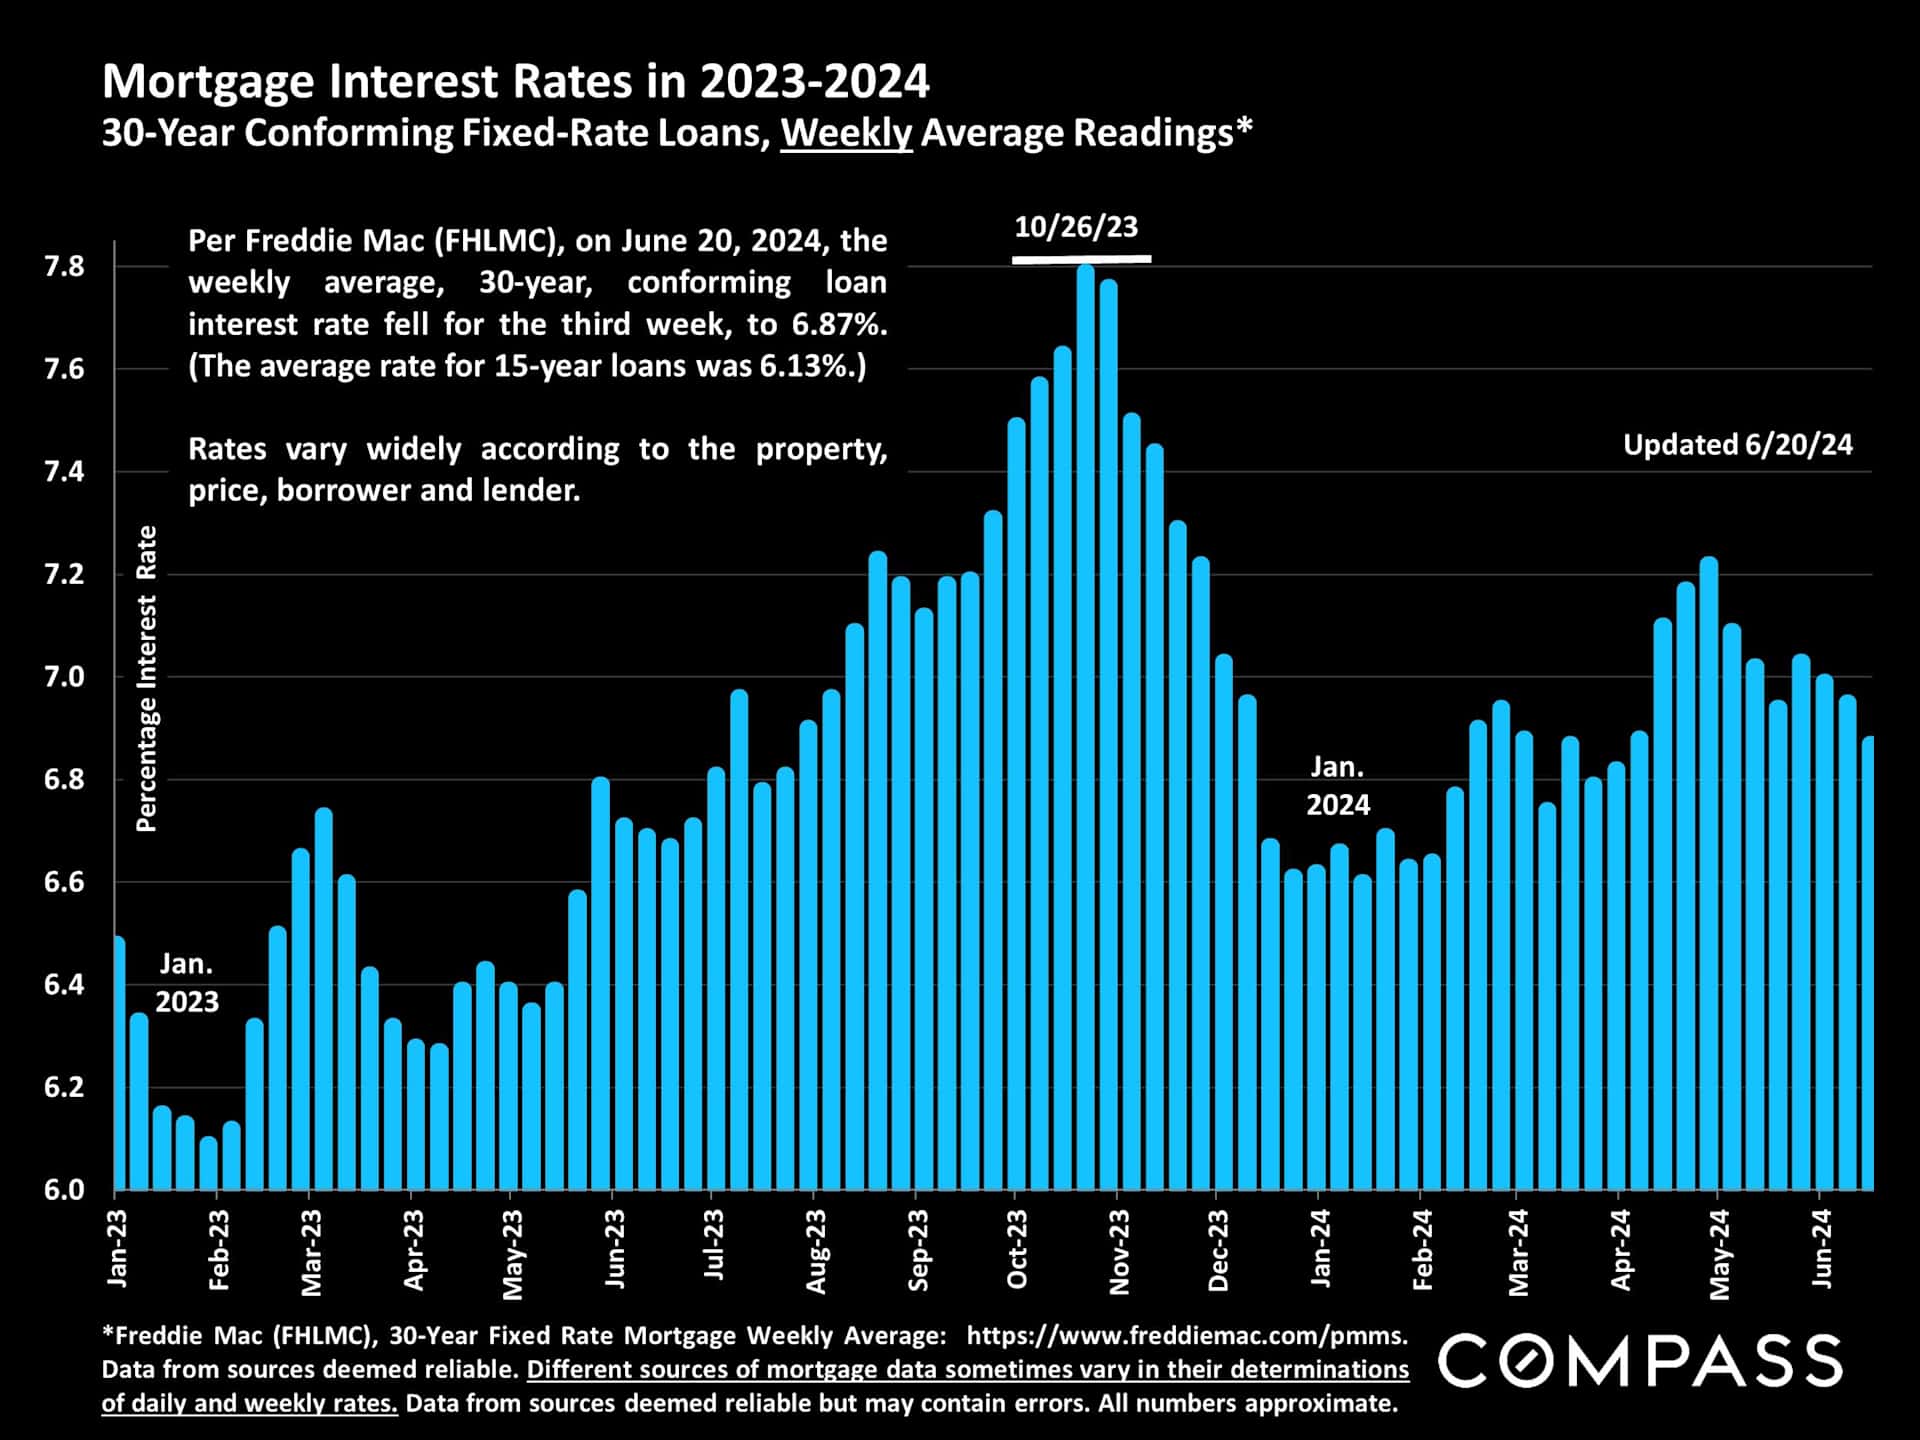
Interest rates continue to react, often very dramatically (and sometimes somewhat inexplicably), to new economic reports. As of 6/20/24, the weekly average 30-year rate has slowly declined for 3 weeks to below 7%.
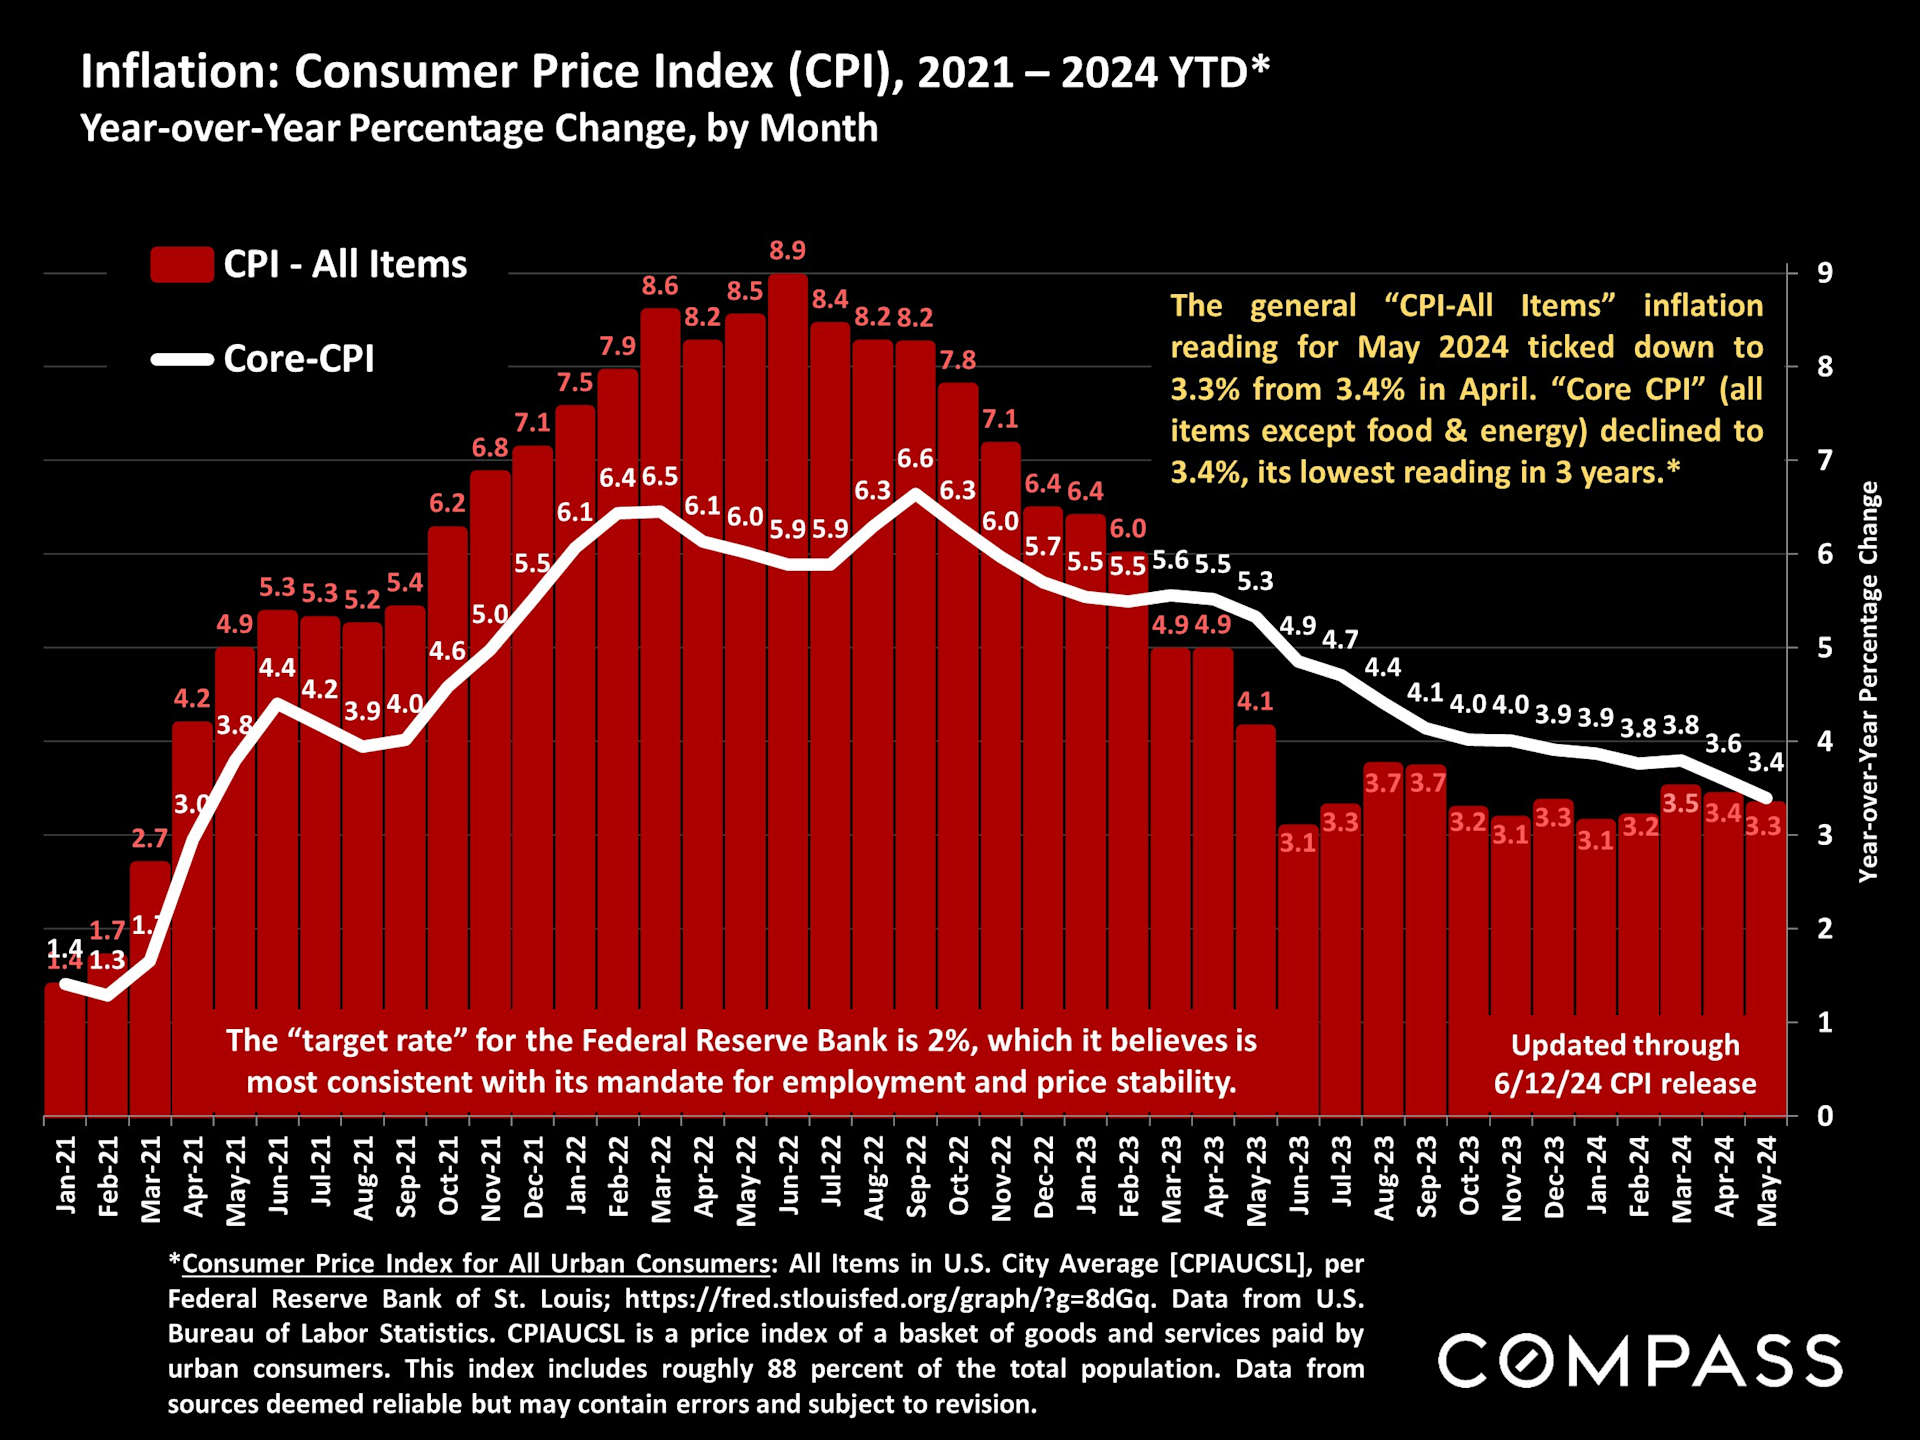
The "core" inflation rate in May dropped to its lowest reading since spring 2021. When and how much the Fed drops its benchmark interest rate depends mostly on what happens to inflation. Though far down from 2 years ago, it is still running higher than the Fed's 2% target.
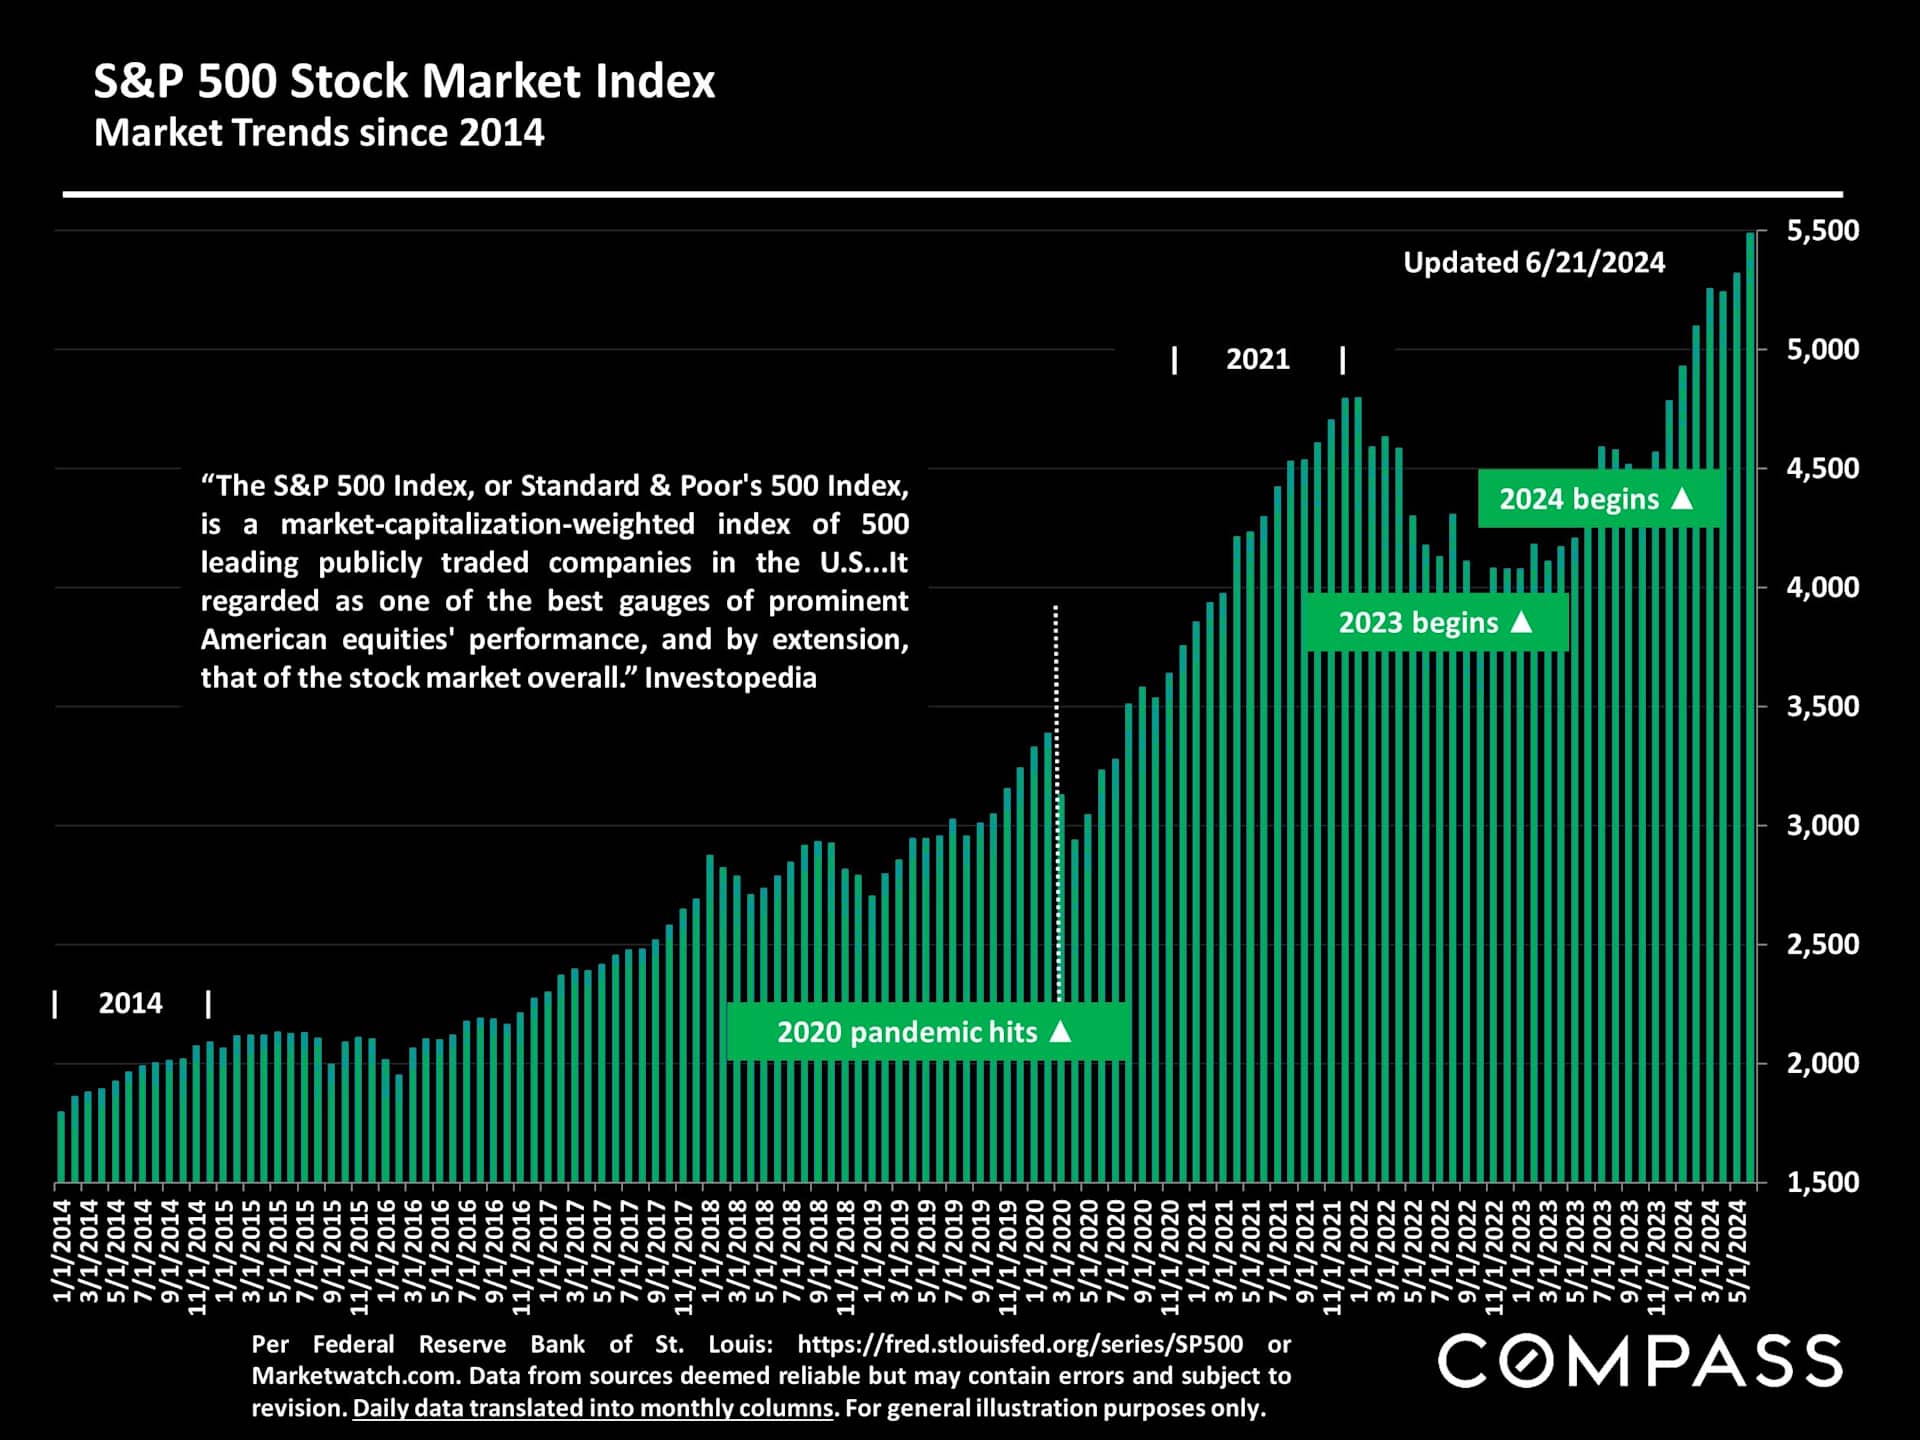
The S&P 500 repeatedly hit dramatic new highs in recent months. (And the Nasdaq's performance has been even more positive.) This has had enormous effects on the household wealth of many prospective homebuyers.
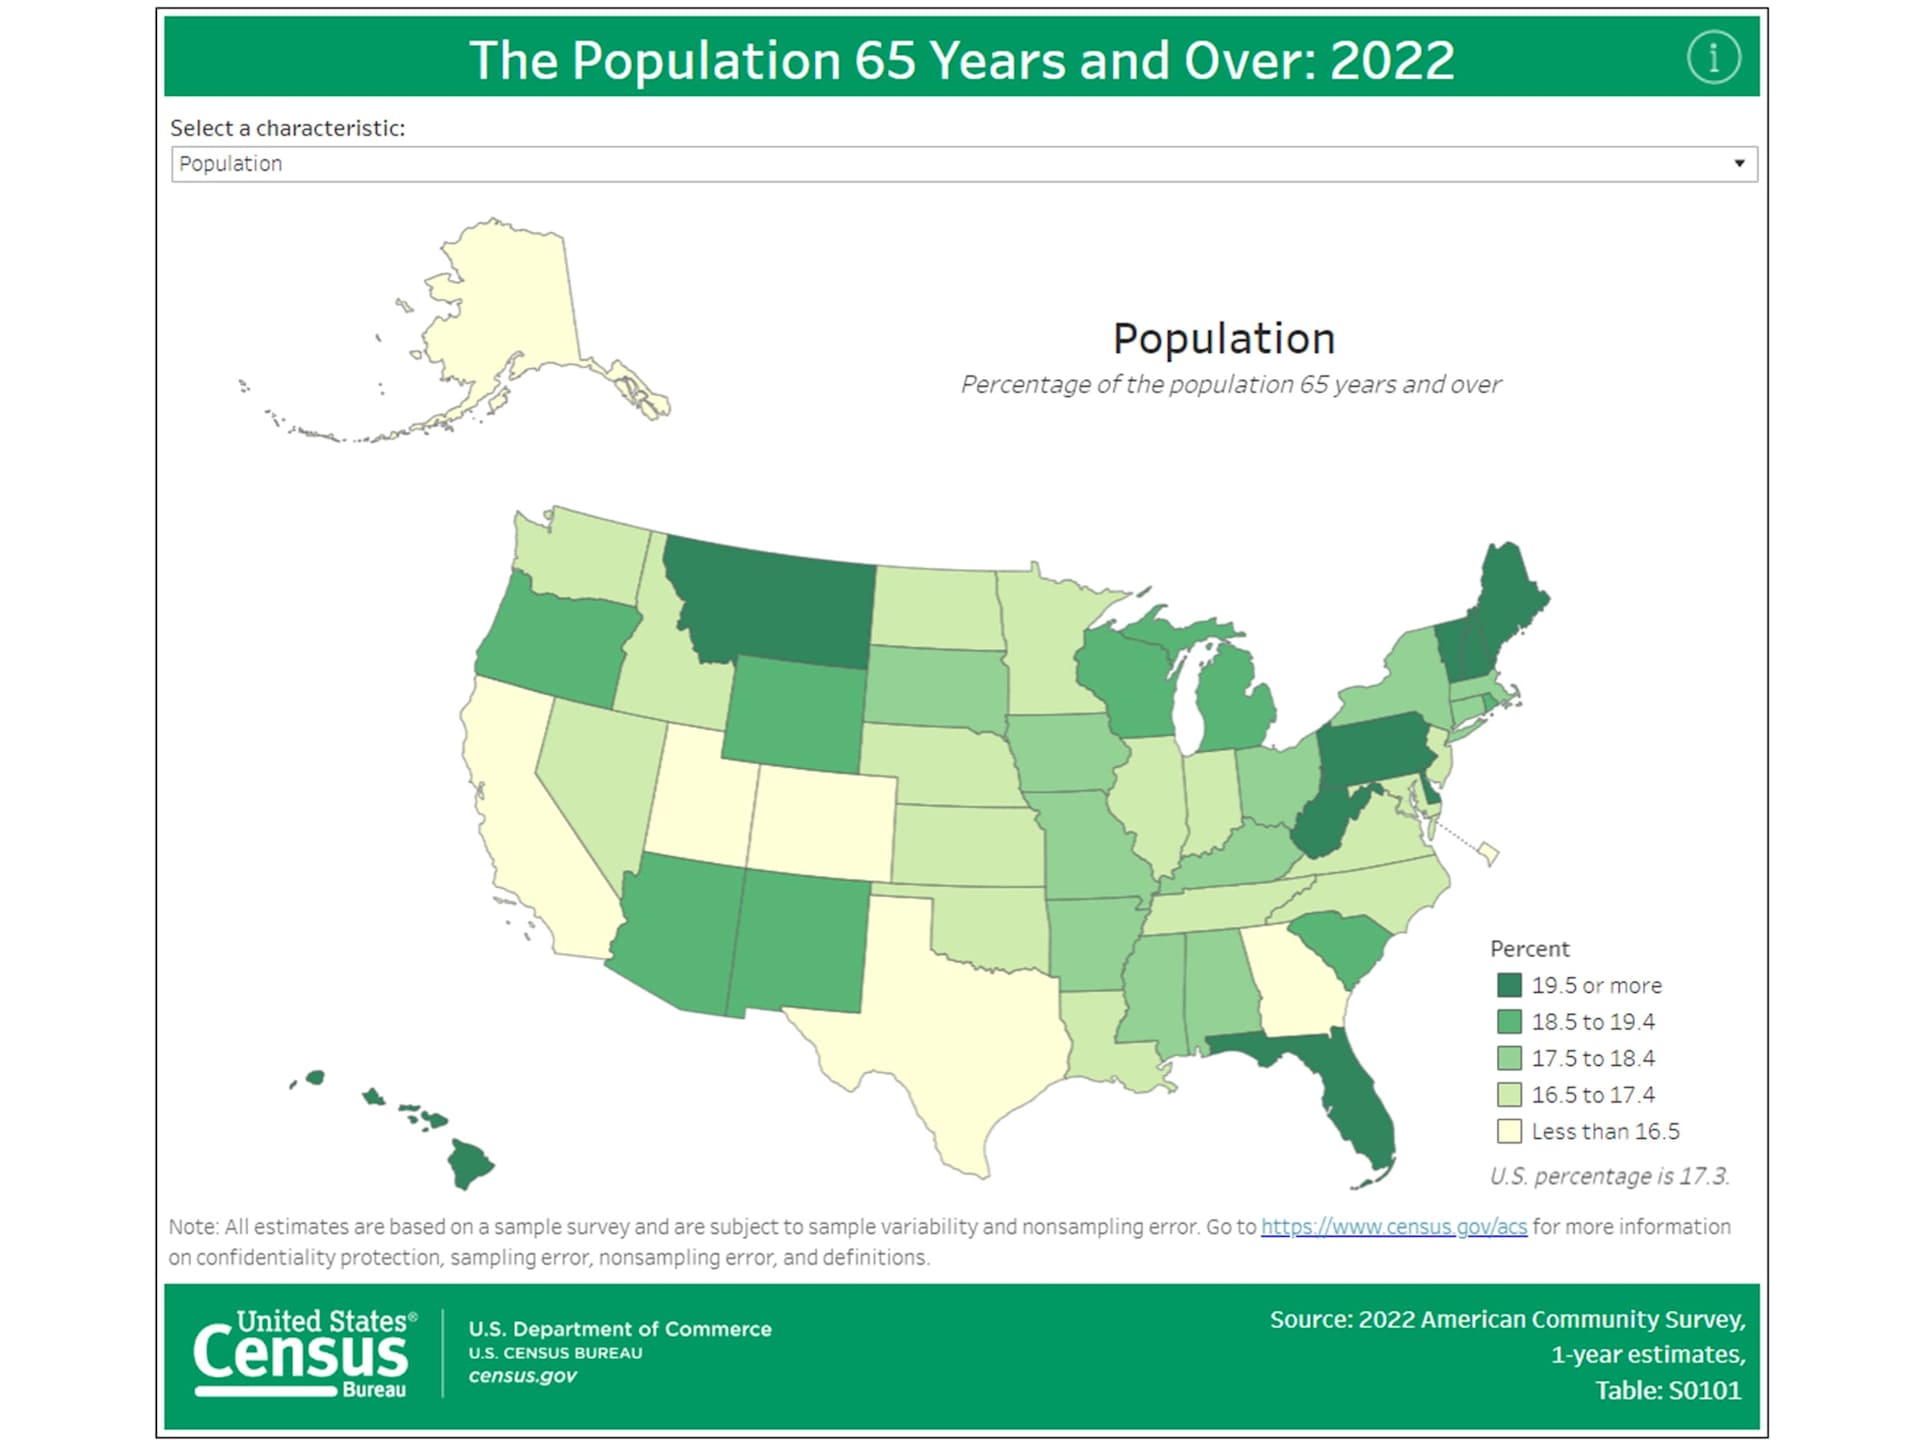
The U.S. Census regularly issues fascinating demographic maps, which also offer insights into housing market dynamics. The new map below illustrates the percentages of state populations aged 65 years and over.