


The U.S median house sales price hits a new peak in June 2024.

Median house sales price appreciation rates since 1990.

The U.S median condo/co-op sales price also hit another new high.

New listing activity is seasonal, typically speaking for the year in May or June before gradually declining to December's low. The number of new listings rose in 2024, but remains significantly below long-term norms.

The number of homes for sale continues to climb, a critical shift in market dynamics and excellent news for buyers.

While the supply of listings has been increasing year over year, the number of sales has declined, an indication of some cooling in demand.

The homes that have sold continue to sell very quickly by long-term norms, though not quite as quickly as in the spring selling reasons of the last 3 years.

Months-supply of inventory measures supply as compared to demand; With more listings and fewer sales, MSI is at it's highest point since the pandemic first hit.

A snapshot of sales across the country - which will not fairly represent home prices in more expensive markets.

Price reductions are running much higher than last year; More sellers are having adjust list prices to regain buyers' attention.

As of mid-July, mortgage interest rates were declining. If this continues, we may soon see the lowest rates in the past 12 months, which could reinvigorate buyer demand (but predicting rates is always challenging).

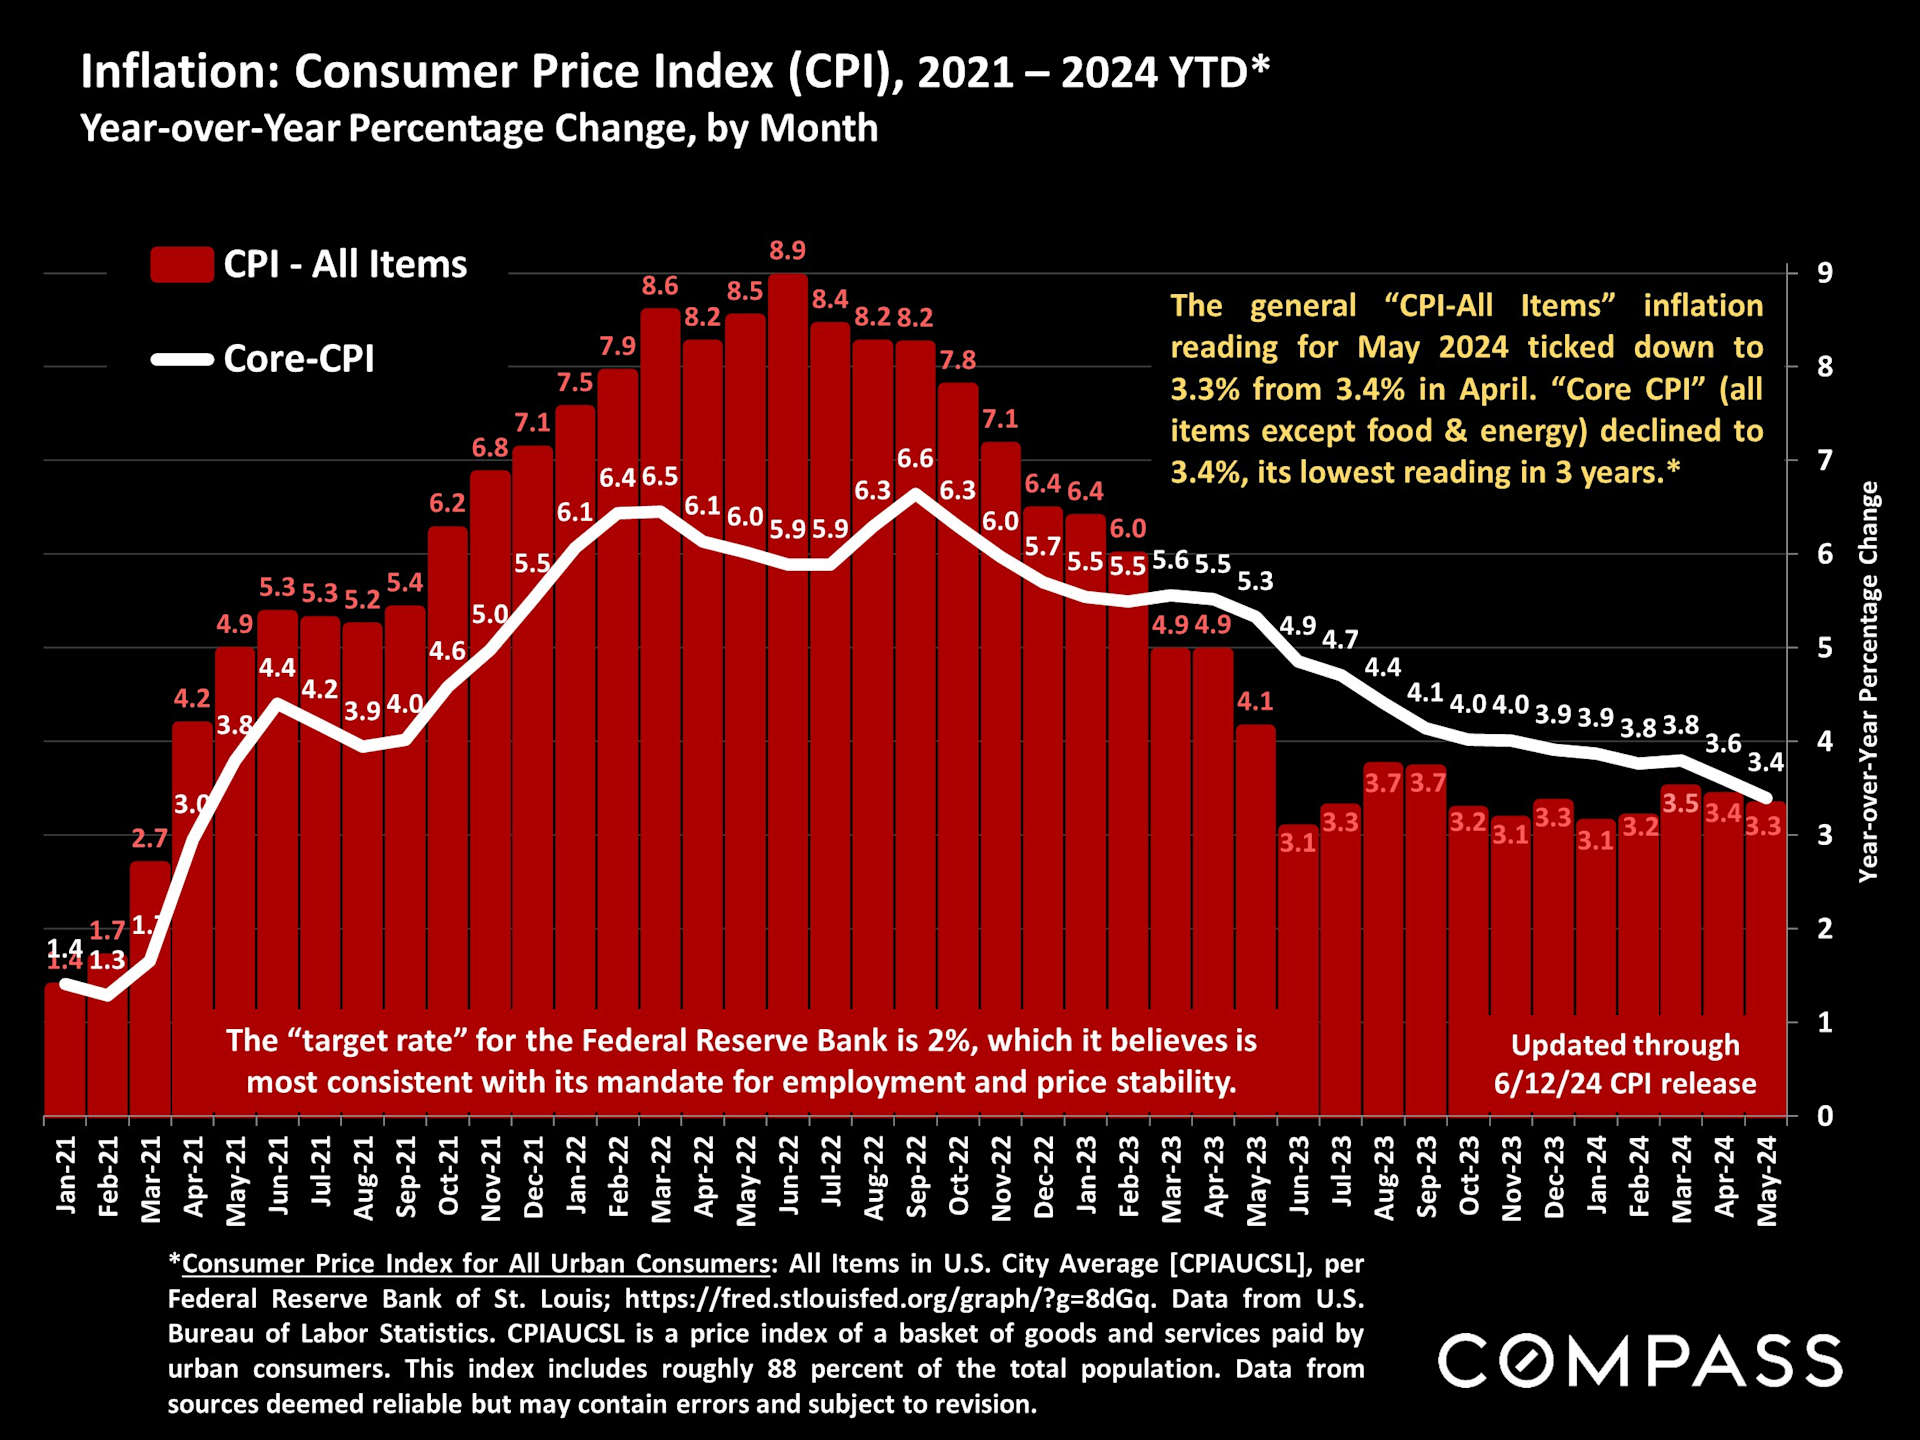
Inflation just dropped to its lowest point in over 3 years, and many analyst predict the Fed will finally start lowering its benchmark rate in September. The key factor is what shows up in upcoming inflation reports.
Foreign-national purchase of US residential property hit the lowest number in 15+ years; Clicking on the summary page below will take you to our full report.